Tableau Desktop allows people to make data-driven decisions with confidence, by helping them answer questions more quickly, solve harder problems more easily, and uncover new insights more frequently.
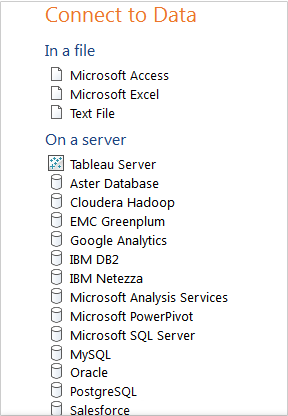
With a couple of clicks, Tableau Desktop connects directly to hundreds of data sources, both on-premises or in the cloud, making it easier to start analysis. Interactive dashboards, drag and drop functionality, and natural language queries help people of all skill levels quickly discover actionable insights, all from an intuitive and visual interface. Ask deeper questions by quickly building powerful calculations, adding trend lines and seeing statistical summaries, or clustering data to see relationships. Better understand your data, make new discoveries, and identify opportunities faster with Tableau Desktop.
Tableau helps people and organizations become more data-driven. With an integrated platform that is easy to start and scale, Tableau supports the entire analytics journey, from data preparation, to deep analysis, to the shared insights that drive the business forward.
Andrew G.
Advanced user of Tableau Desktop
★★★★★
Beautiful charts with a little training
What do you like best?
This is a wonderful Data Visualization software that's a big upgrade from typical Excel charts. Once you figure out how to use it, it does most of the "heavy lifting" for you. It can guess what charts you might want, and is very helpful with analysis.
What do you dislike?
It takes a little bit to learn. It's not immediately clear what everything means, how to access data, and get started. With some training however it begins to make sense.
Recommendations to others considering the product:
Play around with the different types of charts and figure out how to switch you x and y axes. That will really open up what you can make.
What problems are you solving with the product? What benefits have you realized?
Tableau can create beautiful charts to share out with those making decisions, but also does great data analysis while visualizing. More specifically - it allows us to analyze student data, and display in a way that's understandable to make decisions about our program.
Review source: G2.com