Whatagraph

Whatagraph is helping marketing agencies, SEO experts and every business owner in the world get a quick overview of website performance by creating insightful infographics and sending them straight to the e-mail.

Languages supported: English

Platforms: Mac, Win, Linux

Price: $$$$$

Business Size: 0

9.2/10 (Expert Score) ★★★★★
Product is rated as #29 in category Data Visualization Software
Ease of use
9.0
Support
9.4
Ease of Setup
9.3

Images

Check Software Images

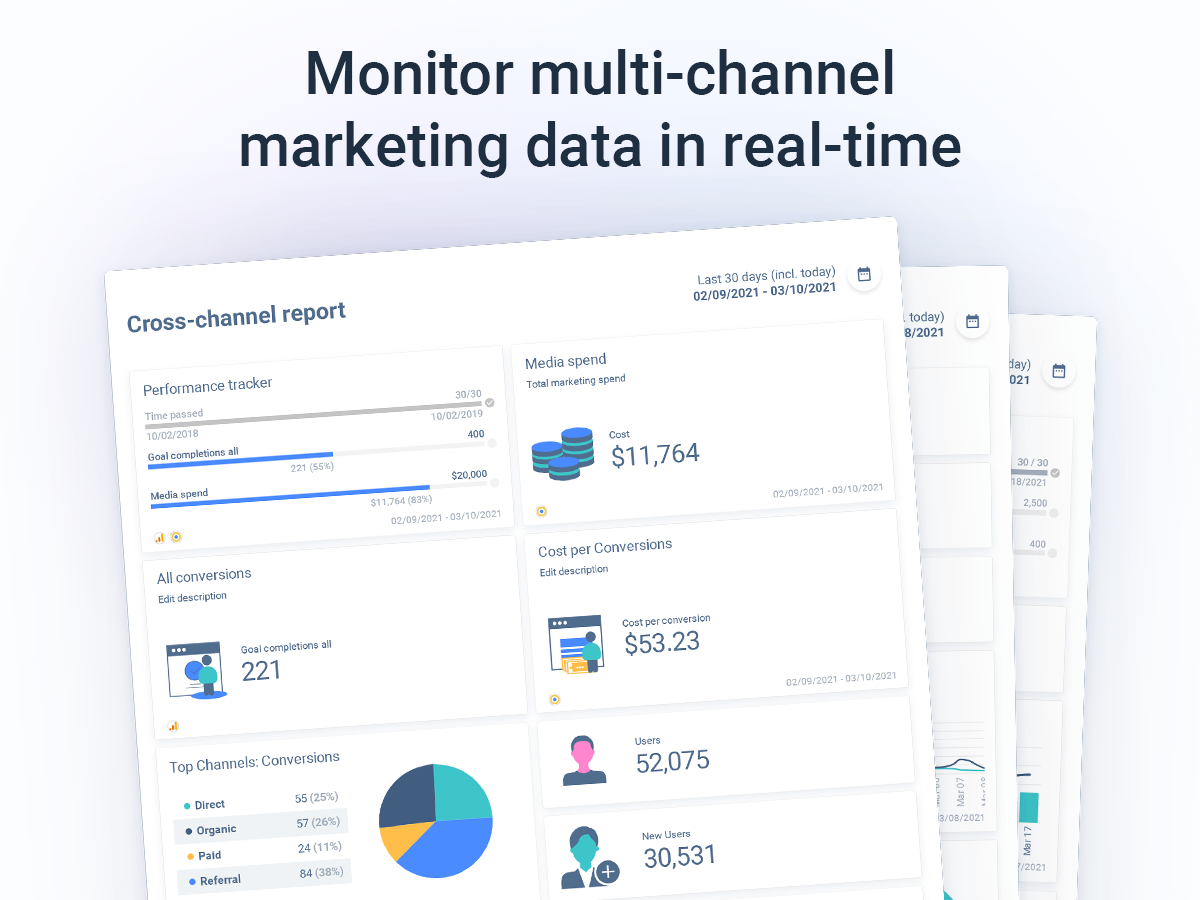
Whatagraph is the best tool for performance monitoring and reporting. Marketing professionals use it to visualize data and build tailored cross-channel reports.

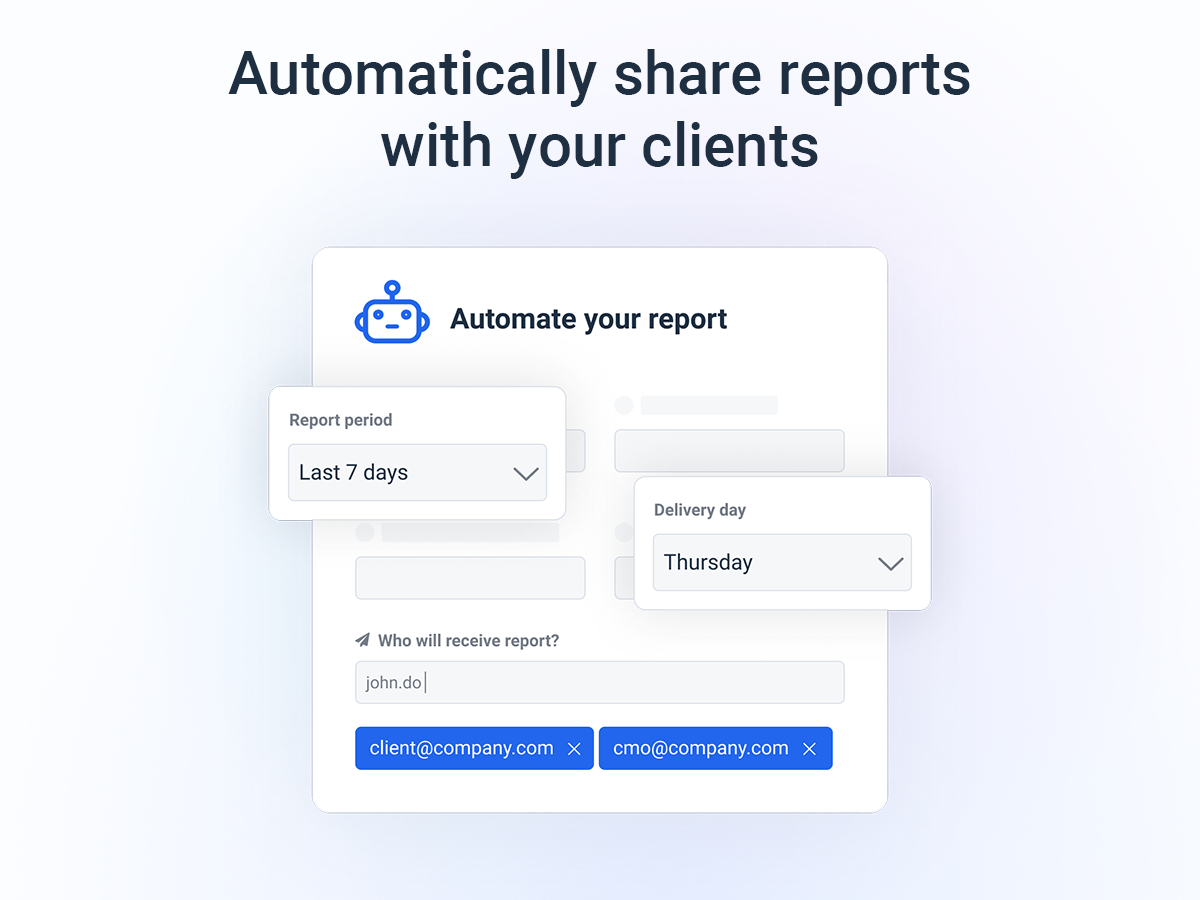
рџљЂAll you need to do is connect your account to Whatagraph – we’ll gather the performance data and transfer it to our platform. The data-pulling process is automated, so you won’t have to collect the numbers manually ever again.

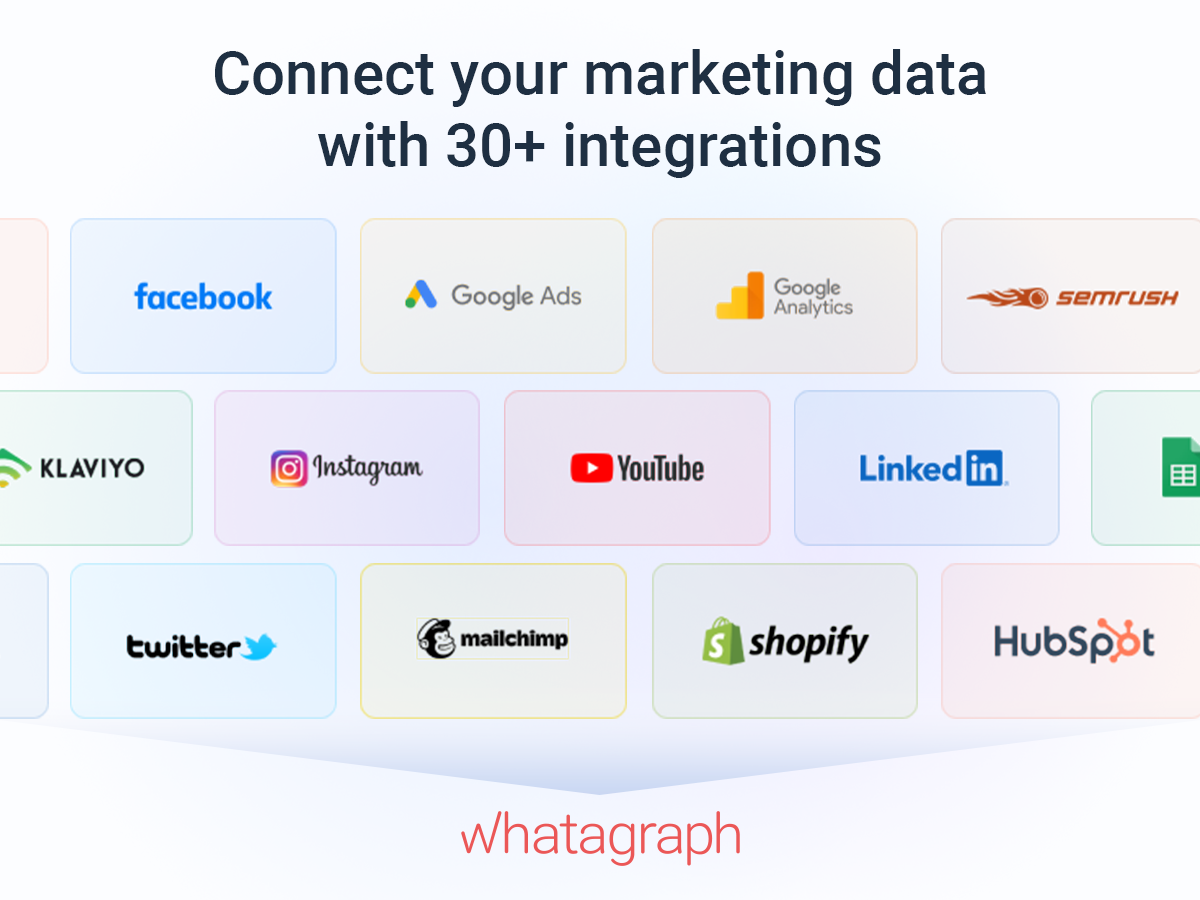
рџљЂ Blend data from different sources and create cross-channel reports. This way, you can compare how the same campaign is performing across multiple channels. Choose from 30+ integrations, including Facebook Ads, Google Analytics, and HubSpot.

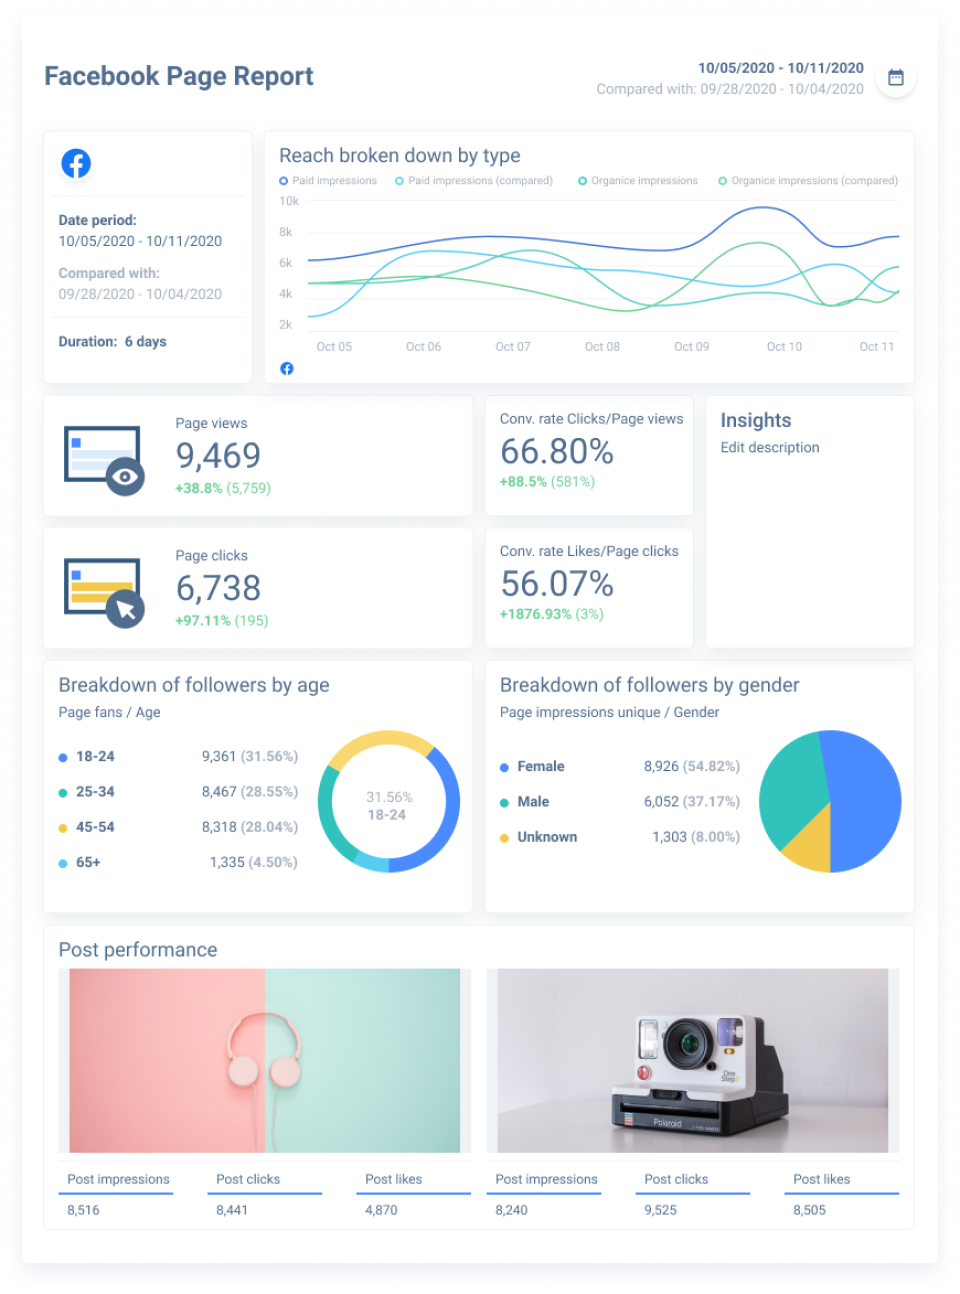
рџљЂBuild visually appealing, easy-to-read reports and help your client understand the data. Share a link to the report, so your client can access it at all times without having to ask.

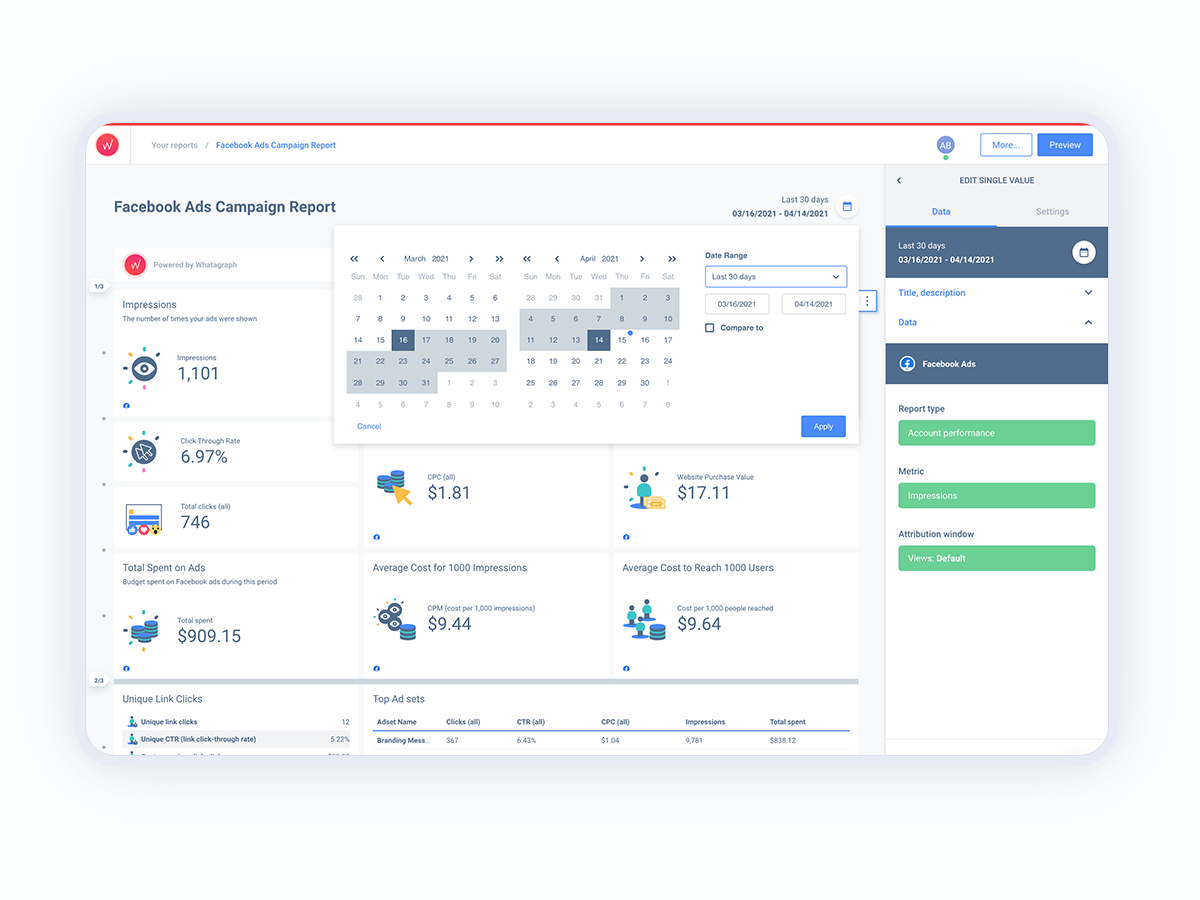
рџљЂCreate reports from scratch or use pre-made widgets and templates. Whatagraph offers ready-to-go report templates for different marketing channels, including SEO, PPC, social media, and others. By using a pre-made template, you can build a performance report in minutes and prevent human errors at the same time!

рџљЂ Team up with your colleagues: share a link to the live report, and you’ll be able to work on it together simultaneously.

рџљЂAdd custom data from any source. We’re constantly updating our integration list based on our clients’ requests. But if a particular one isn’t available yet, you can transfer data from anywhere with Google Sheets and Public API integrations.

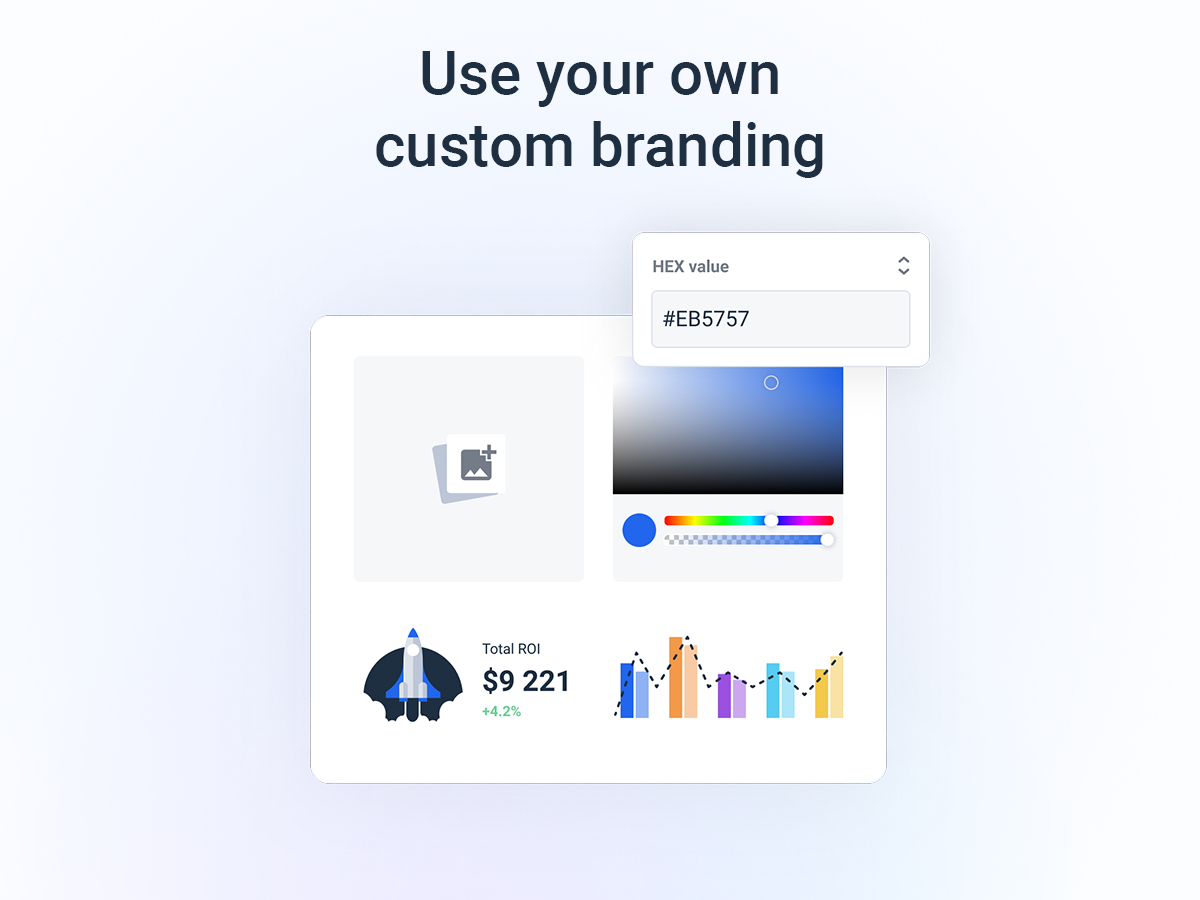
рџљЂ Style your reports any way you want: use branded colors, add a company logo, and more. This way, your report will truly represent your client’s brand. Plus, they’ll surely appreciate you putting extra effort into the work!

By using Whatagraph, you’re reducing the frustration of spending hours collecting data manually. One of our clients has said their productivity has improved drastically: instead of 3 working days, now it takes just a day to create the report, saving the company 2 full business days per month.

At the same time, you’re making data accessible to anyone – by visualizing the numbers, you’re turning complex information into something easier to digest.

Whatagraph
Whatagraph

Show more categories

Customer Reviews

Whatagraph Reviews

Connie S.

Advanced user of Whatagraph
★★★★★
Reporting made clean and simple.

What do you like best?

Switching to Whatagraph made a huge impact on our company. Both for our clients and our team. Gone are the days of hand creating reports or using a clunky reporting platform. No more taking screenshots of data and spending hours attempting to create reports for clients.

Whatagraphs platform integrates seamlessly with all of the platforms we use and allows us to create visually stunning reports. New features like real-time live reporting help us to track campaign performance and make adjustments quickly to keep our clients on top. Daily, weekly monthly, annual and live reporting options allow us to determine campaign performance at any step any time.

The tech team is also aces. Anytime we have a problem, help is just a chat away. The team is always quick and courteous, a real pleasure to chat with and they have never failed to resolve an issue for us.

What do you dislike?

There's not really anything that I dislike about Whatagraph. From layout to features to tech support I love working with Whatagraph. The only issue that we have is that one or two of the platforms we work with (Yext in particular) don't yet integrate. However, I don't see this as a huge downfall, they continuously add integrations and I feel certain it's only a matter of time before the platforms make their way onto the list.

Recommendations to others considering the product:

If you want ease of use and clean simple reporting this is the platform for you!

What problems are you solving with the product? What benefits have you realized?

Whatagraph has solved almost every reporting problem we have. As for benefits:

-Daily, weekly, monthly, annual and live reporting

-Large inventory of integrated platforms

-User-friendly interface

-Clean visual reports

Review source: G2.com

Leave a reply

Your total score

B2B Software Guide