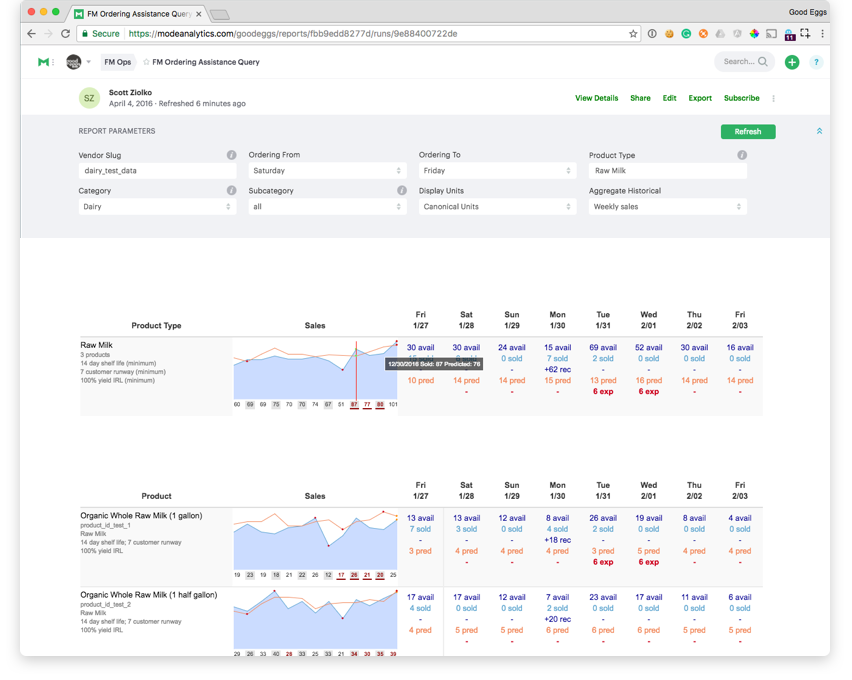
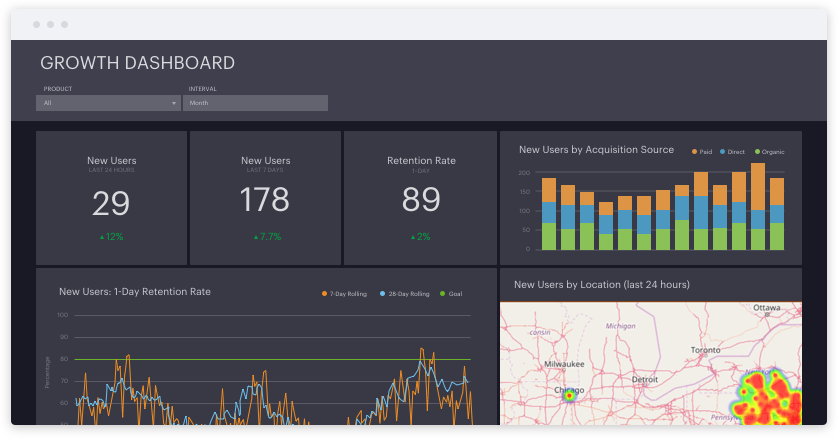
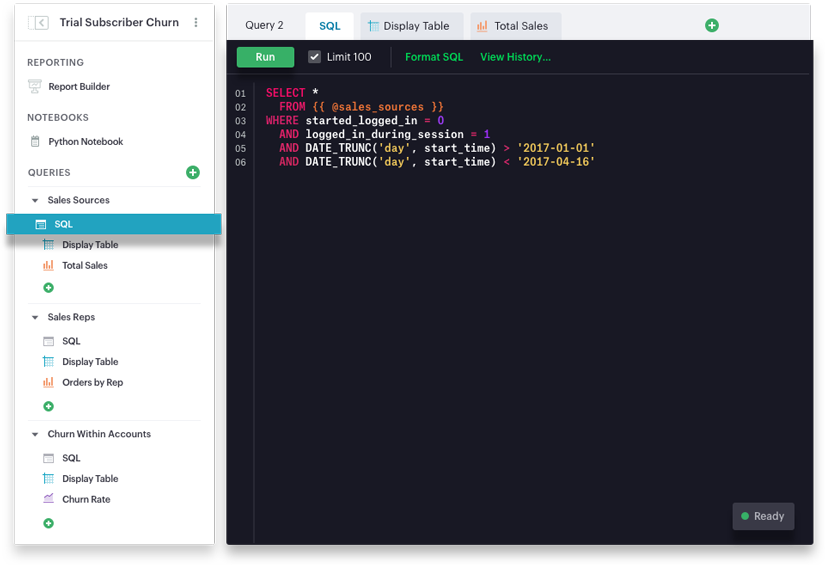
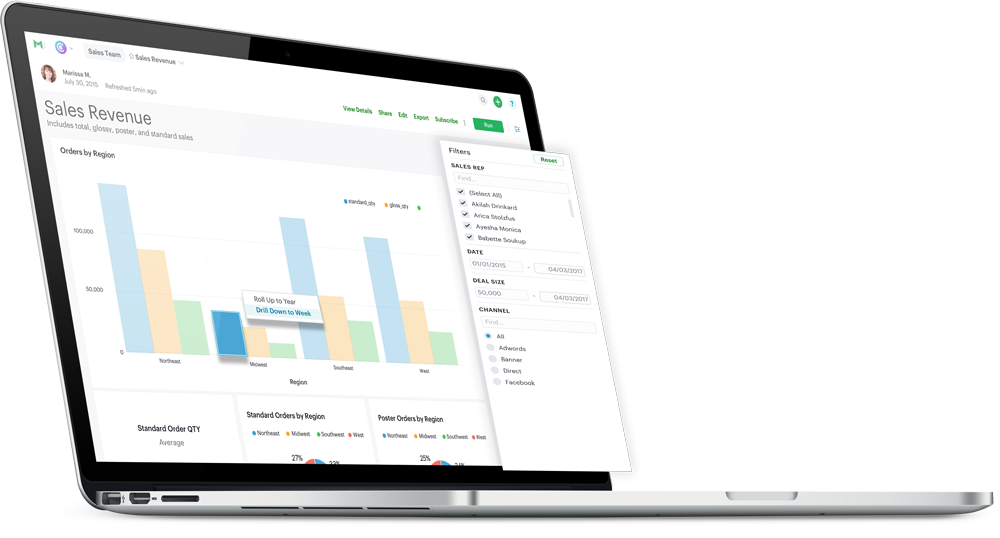
Mode helps companies make better decisions and answer new questions by unlocking the value in data. Mode’s collaborative analytics platform combines SQL, Python/R notebooks, interactive visualizations—both out-of-the-box and custom using HTML, CSS, and D3.js—and shareable live reports. Analysts, data professionals, and stakeholders can collaborate, analyze, and explore.
Mode
Images
Check Software Images
Customer Reviews
Mode Reviews
Rita L.
Advanced user of ModeWhat do you like best?
Mode is a handy query and dashboarding tool for creating quick, helpful analytics for our teams and executives. It allows for seamless integration of SQL, Python/R and visual analytics on one platform. Another highlight of Mode is its support feature - live agents are available to answer any questions regarding querying/the UI itself, creating a very interactive experience.
What do you dislike?
While most visualizations for daily needs are available and intuitive, some more advanced features offered on other BI tools are still missing on the platform (e.g. clustered stacked bar graphs etc.). Nevertheless, Mode is extremely receptive to user feedback, and constantly evolves to add new features. Pivot tables and calculated fields, for instance, were once hotly requested features that are now available.
Recommendations to others considering the product:
Consider this tool for your organization's analytical needs! It's easy to learn and incredibly powerful.
What problems are you solving with the product? What benefits have you realized?
Visualization, data querying, dashboarding, generating business intelligence. It's a great tool to whip up a data "presentation" to show trends, elucidate changes, show leaders and laggers, share knowledge, and explore data in general. It's a tool that is incredibly powerful, yet able to generate simple to digest outputs for a broad audience.


