Microsoft Power BI - visualization talks itself
What do you like best?
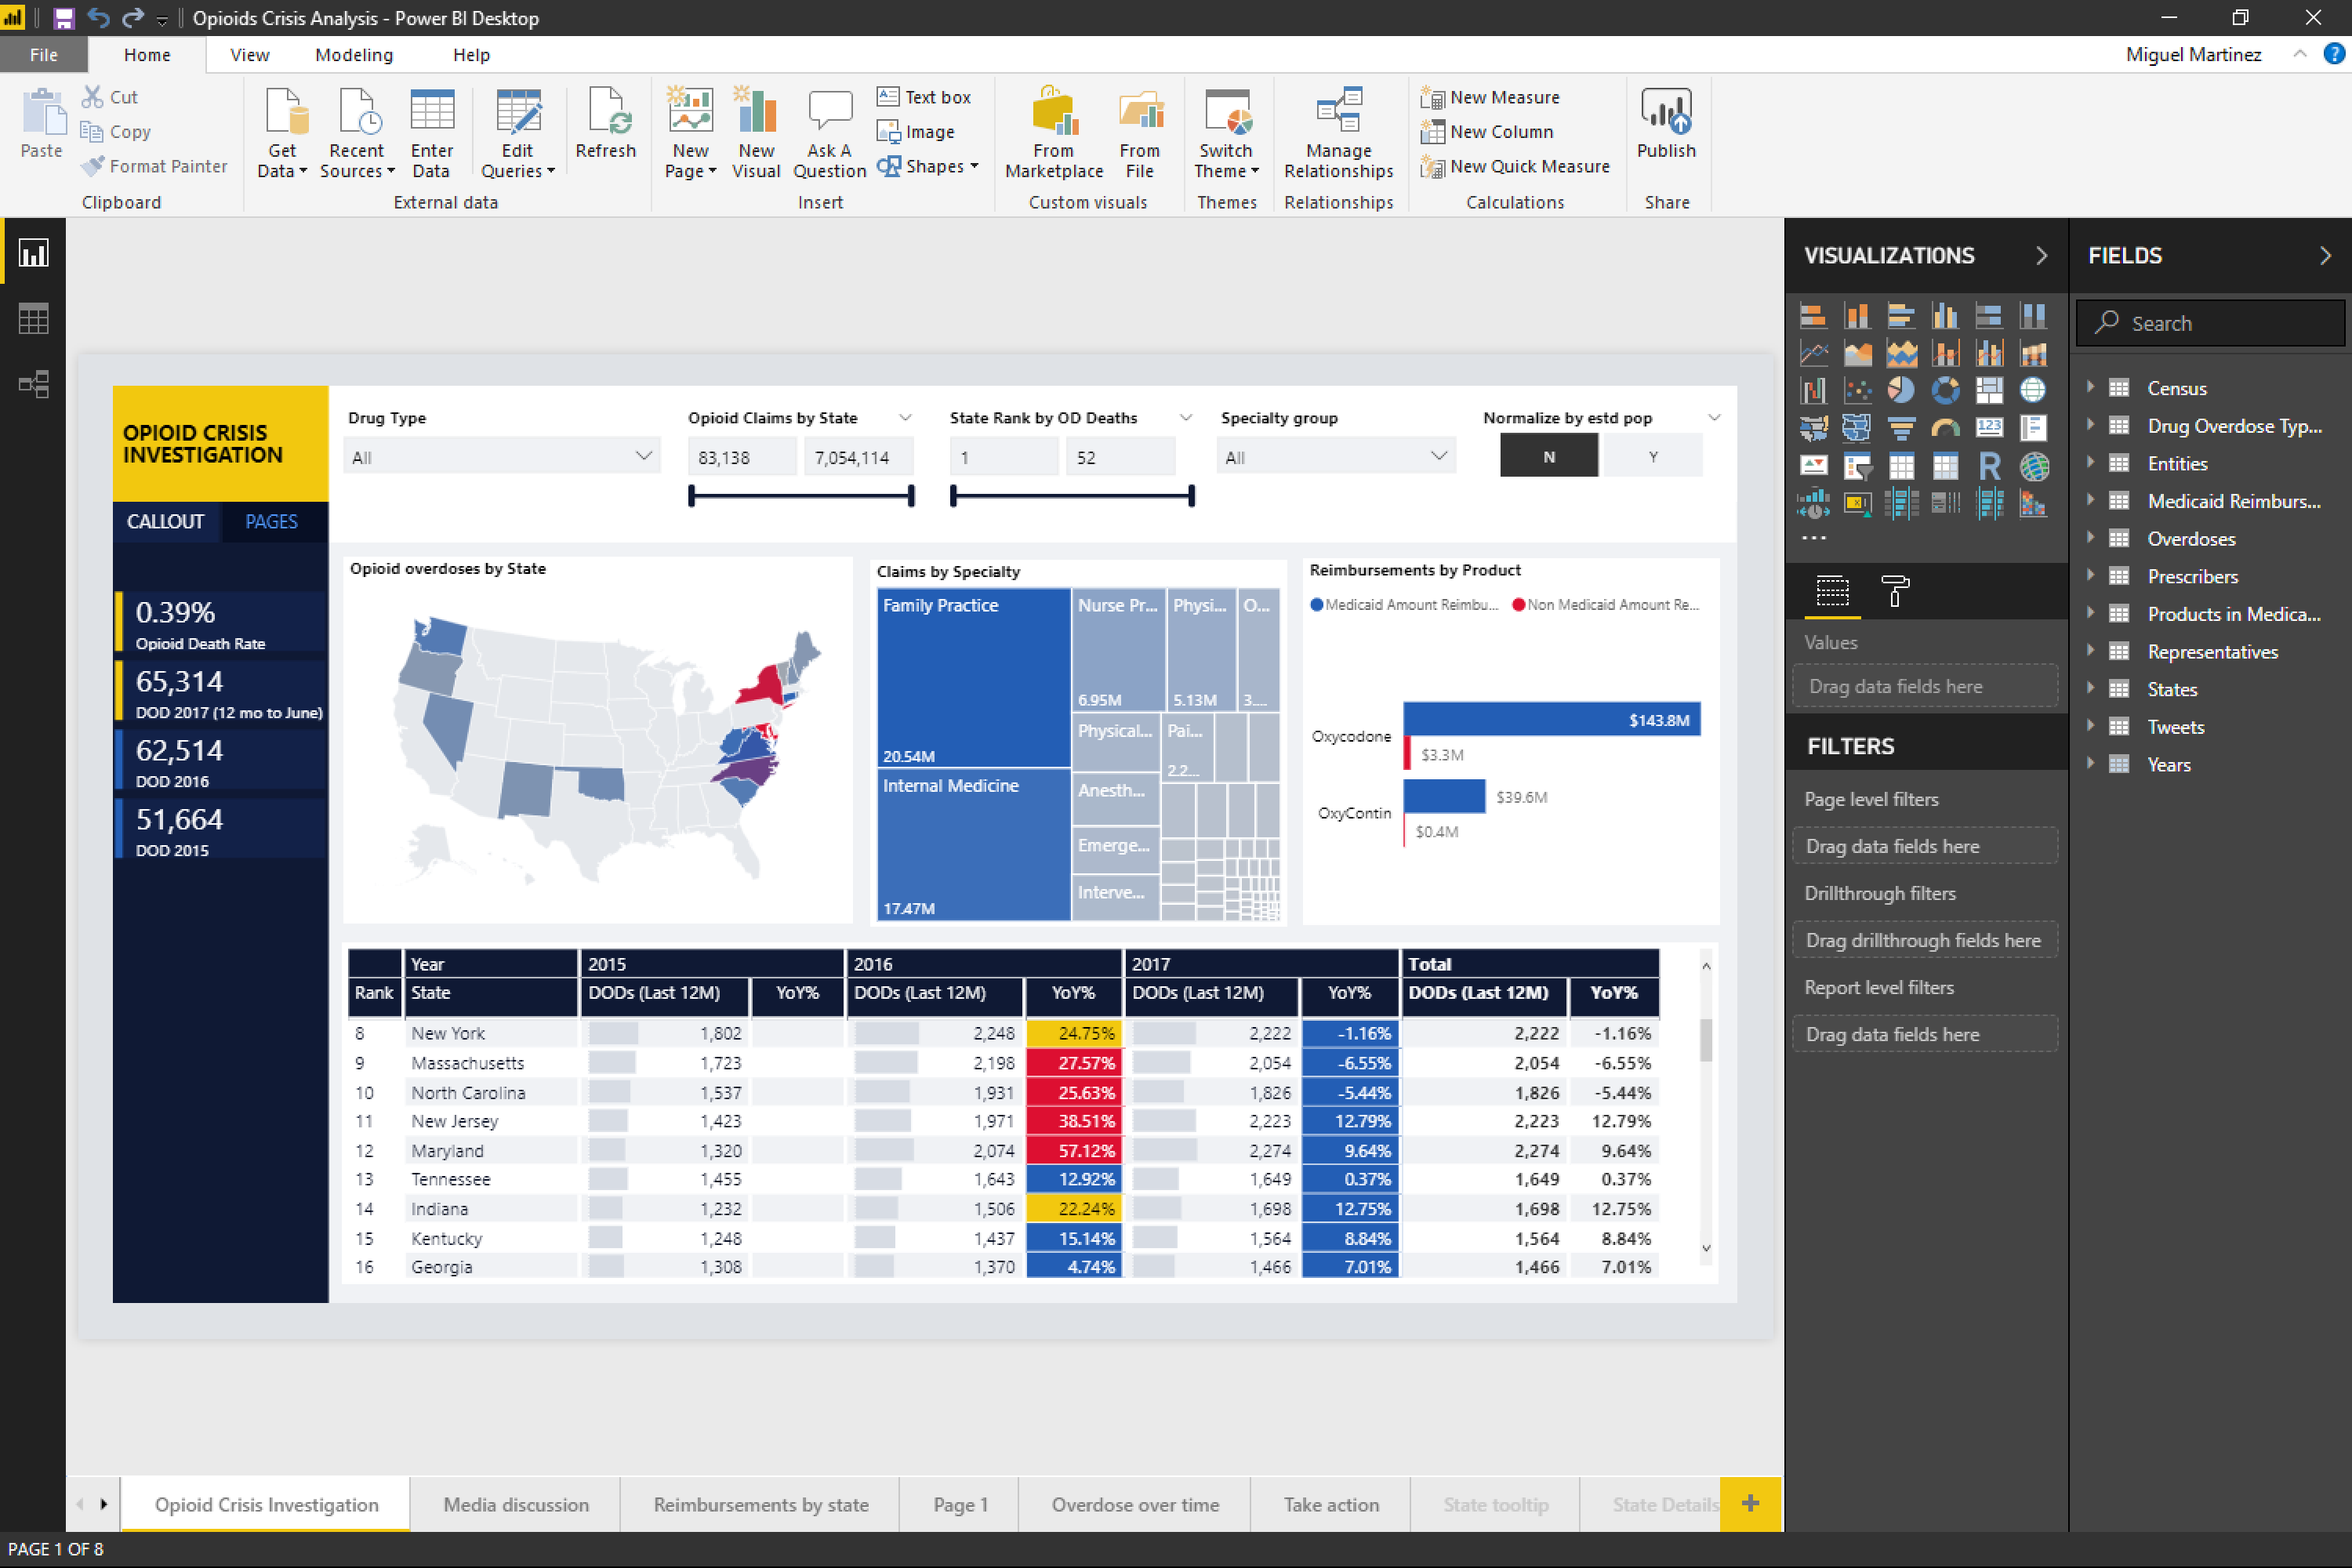
a. Vibrant personalized dashboard feature.
b. Refresh the data to get the updated dashboard anytime.
c. Drag and drop feature for dashboard against the specific data field.
d. Information and data security.
e. Accuracy level is exceptionally high.
f. Easy interpretation of the data.
g. Availability in computer and handset.
In addition to these, the acceptability of this tool by the business professional has been inspiring the young leaders.
What do you dislike?
a. Not easy to use ( it requires at least a brief and hands-on training for a new incumbent to start with Microsoft Power BI).
b. Lacks a good tutorial in the initial stage by this software.
Recommendations to others considering the product:
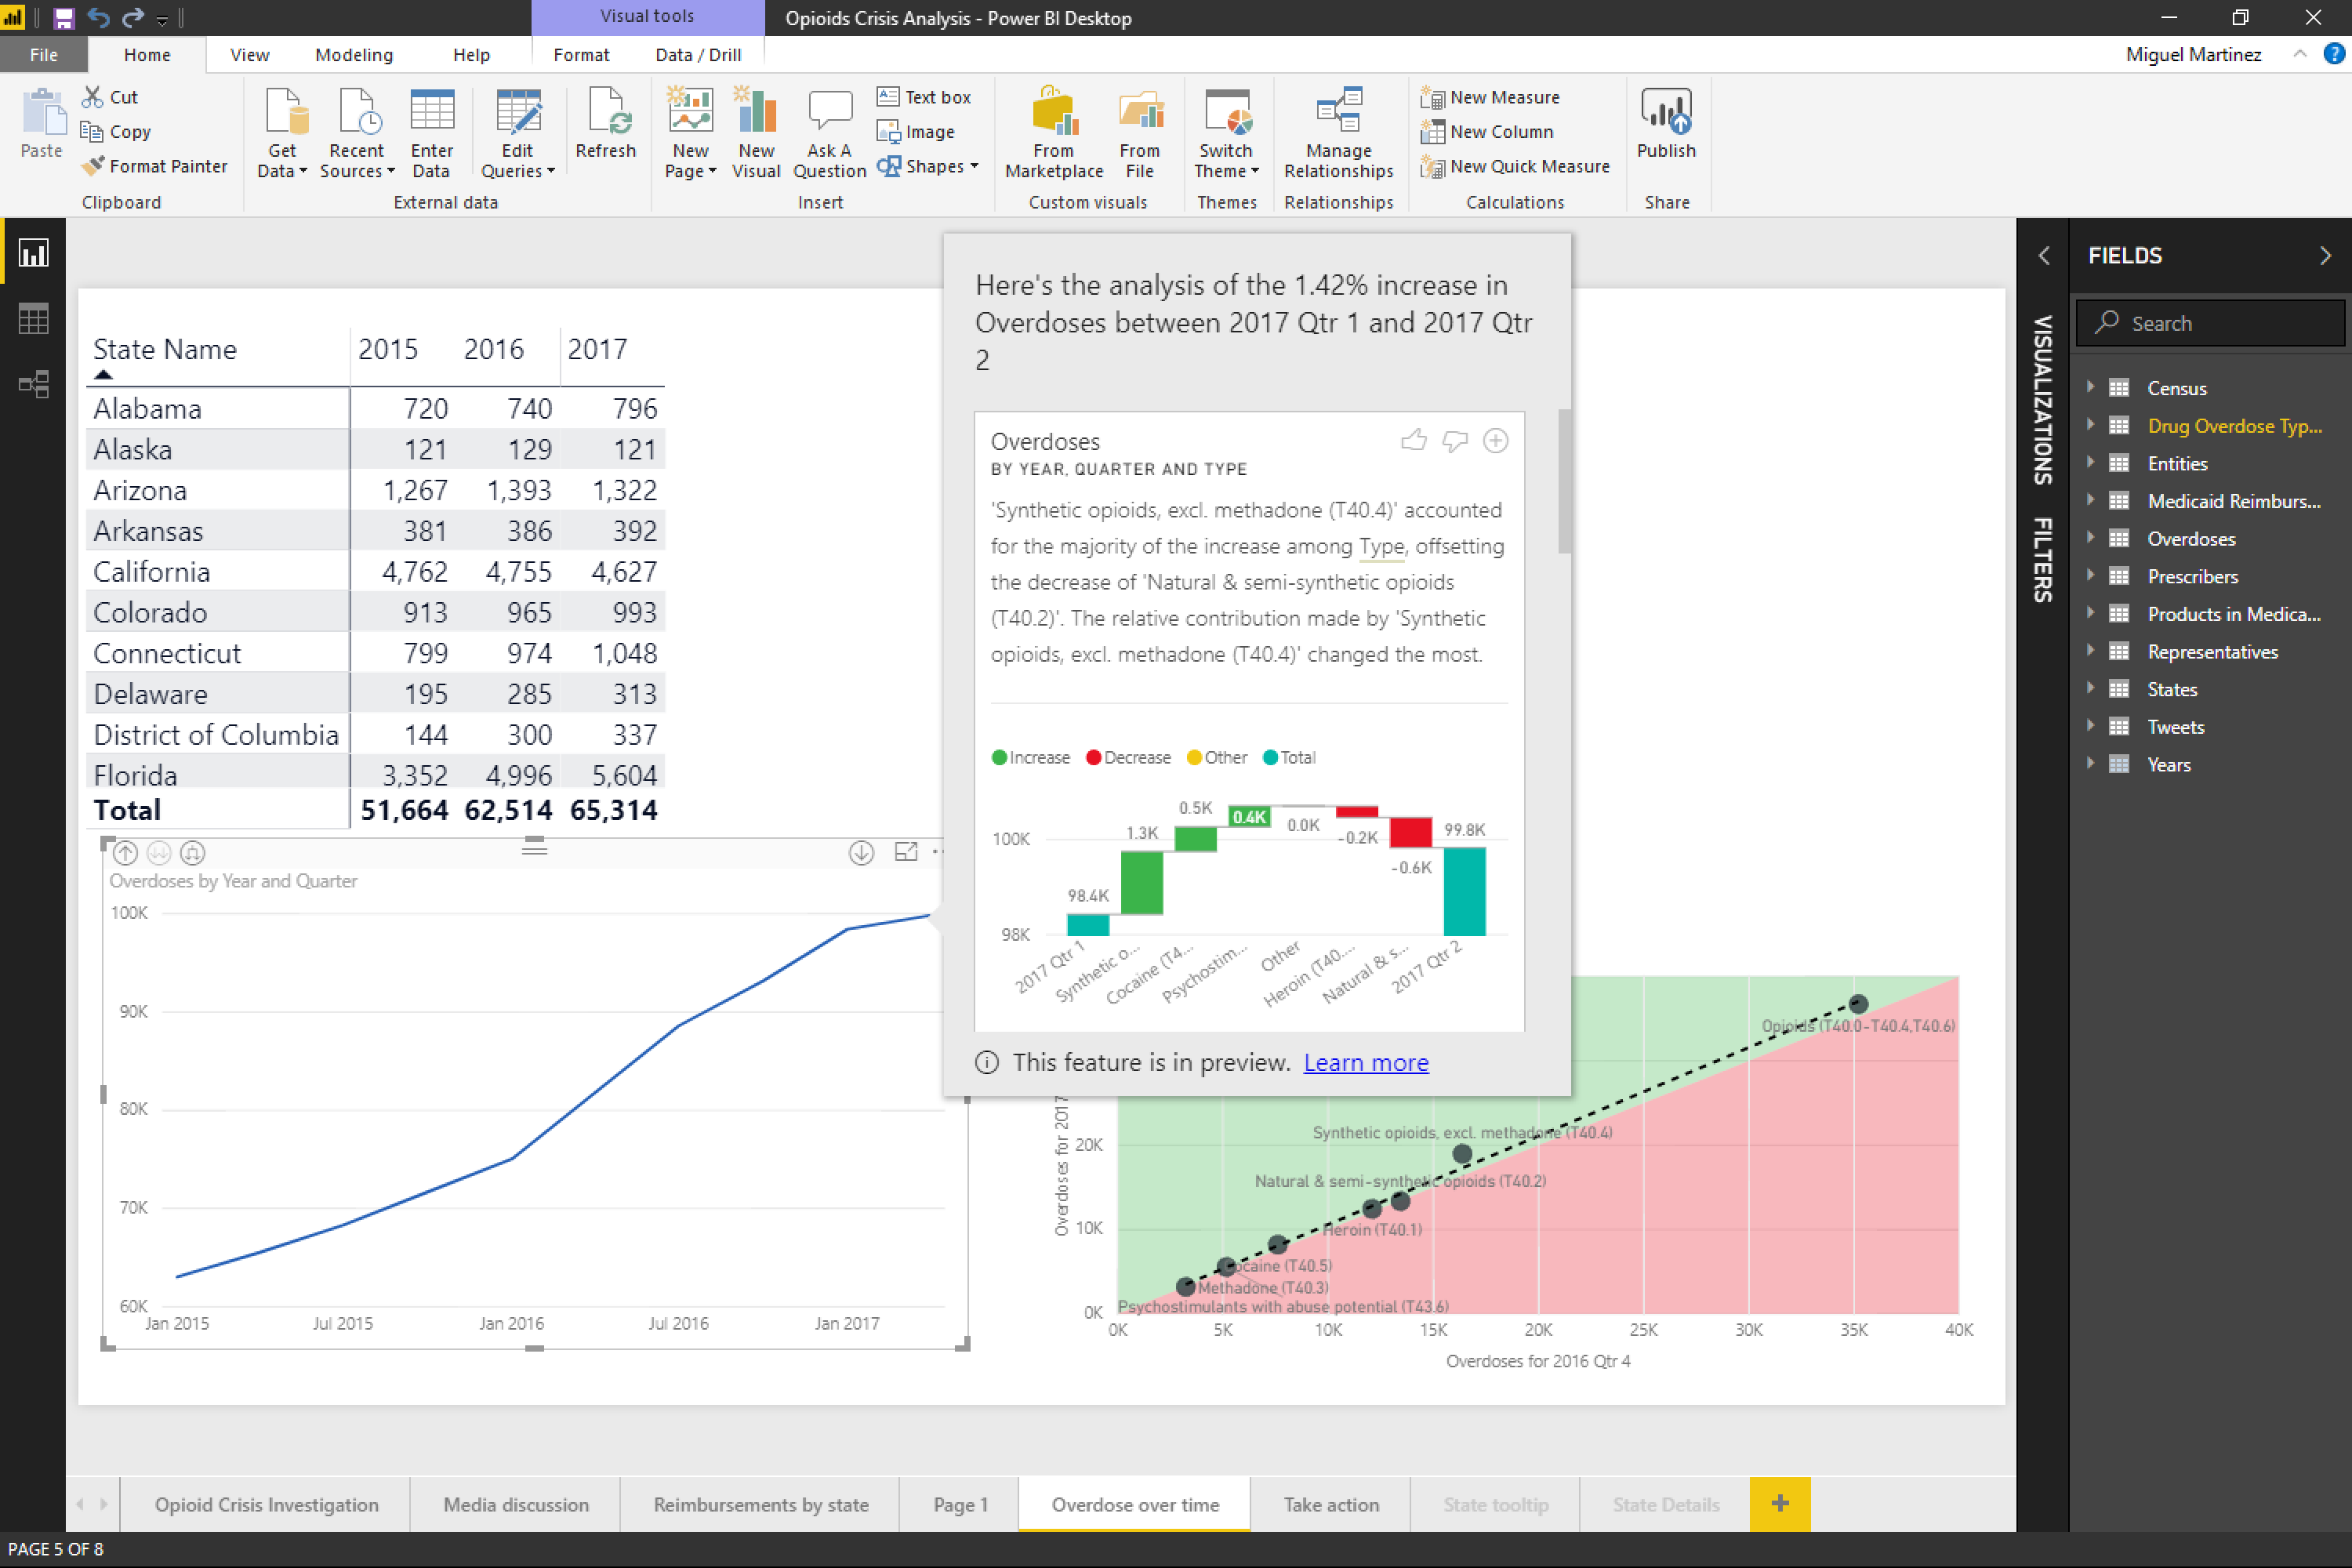
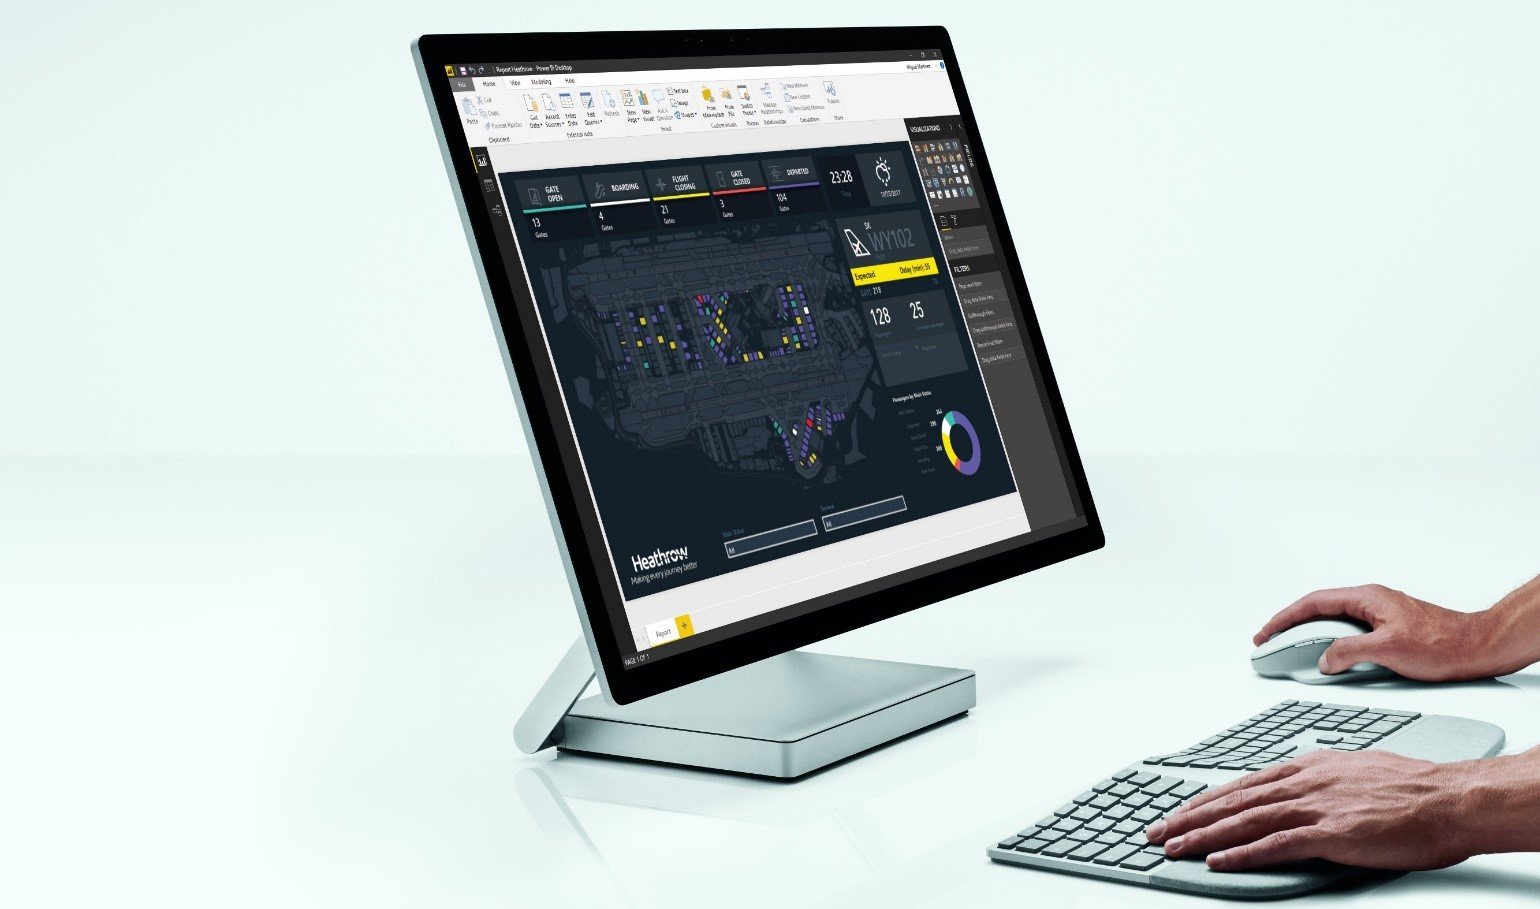
Microsoft Power BI is the best visualization tool that I have used so far. It enables the leadership team and senior managers to get the authentic vibe of the operations/business through the dynamic dashboard and graphical representation, which helps make decision-making at large.
What problems are you solving with the product? What benefits have you realized?
a. Analyzing the business data in a very structured way that is easily understandable to the audience with the dynamic & vibrant dashboard.
b. Excellency in visualization, getting me an edge over against my peers.
c. Spent management, cost analysis, and run to target capturing.
d. Learnt different aspects of data analysis and visualization.


