Real time memeory monitoring and analysis
What do you like best?
It's an essy to use application. Installation process is simple and quick. Memory Profiler connectivity with visual studio is fast and seamless. Application's customization is pretty smooth like i can easily define the time interval for auto snapshot. Control profiling can be hadled manually or via API.
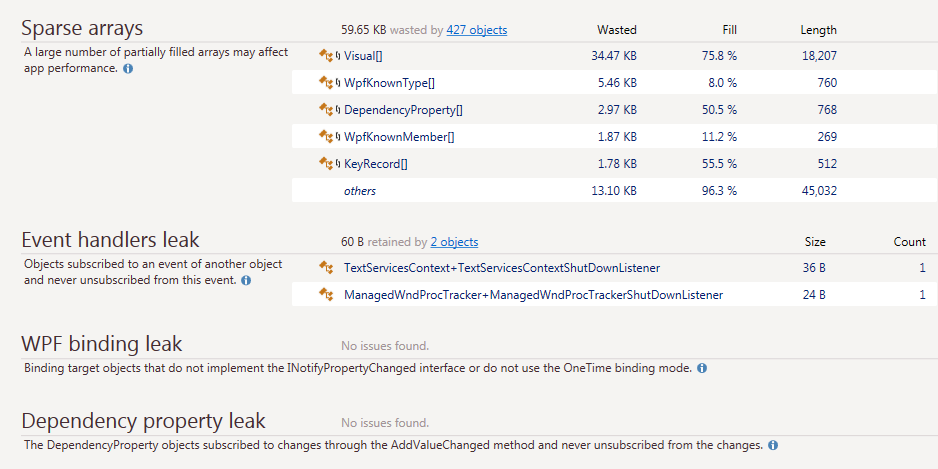
Application's memory profiling is straightforward and it automatically inspects memory issues. We are easily able to identify un-necessary and high memory usage in our applications. Memory allocation's detailed description is very helpful during analysis. It provides detail of arrays and objects which are responsible for memory wastage and consuming high memory. As well as it provides memeory leakage details related to binding and event handler.
It's sunburst digram generates the memory retention issues details like path of retention, objects etc. So this makes my investigation task easy and overall it's effortless.
This reveals memory consumption details as well and generates breakdown details of same. Each session has details in new tab so efficiently can compare the result of different sessions.
What do you dislike?
So far not much to dislike, its generaring efficient result for us.
Recommendations to others considering the product:
Yes. If someone is looking for memory issue analyzer then go for this. It's a convenient and reliable tool.
What problems are you solving with the product? What benefits have you realized?
Analyzing un-necessary memory usage in web applications. Optimized applications perfromance. Memory traffic review is quick, easy and simple.