dbMonitor

dbMonitor is an easy-to-use tool designed to provide visual monitoring of database applications.

Languages supported: English

8.0/10 (Expert Score) ★★★★★
Product is rated as #37 in category Database Monitoring Software
Ease of use
Support
Ease of Setup

Images

Check Software Images

dbForge Monitor is a FREE add-in for Microsoft SQL Server Management Studio that allows you to track and analyse SQL server performance. The tool includes a variety tools for SQL Server diagnostics, including a bunch of SQL performance metrics allowing to see the comprehensive and clear picture of all processes taking place on the server, detect most expensive queries, waiting tasks, and performance bottlenecks. With dbForge Monitor, you will save hours of time spent on SQL Server performance analysis!

Key Features:

* Dashboard The Overview tab of the tool allows you to see what actually happens at your SQL Server from various angles. A rich collection of metrics for versatile monitoring of SQL Server performance includes: – CPU Utilization – Memory Utlization – Disc Activity – Read and Write Latencies – IO latency

*Data Input/Output With the IO data tab of the tool, you can easily view statistics of the read and write operations for each database file. In particular, you can track: -Total amount of data reads and writes -Count of input/output operations -Read/write latency

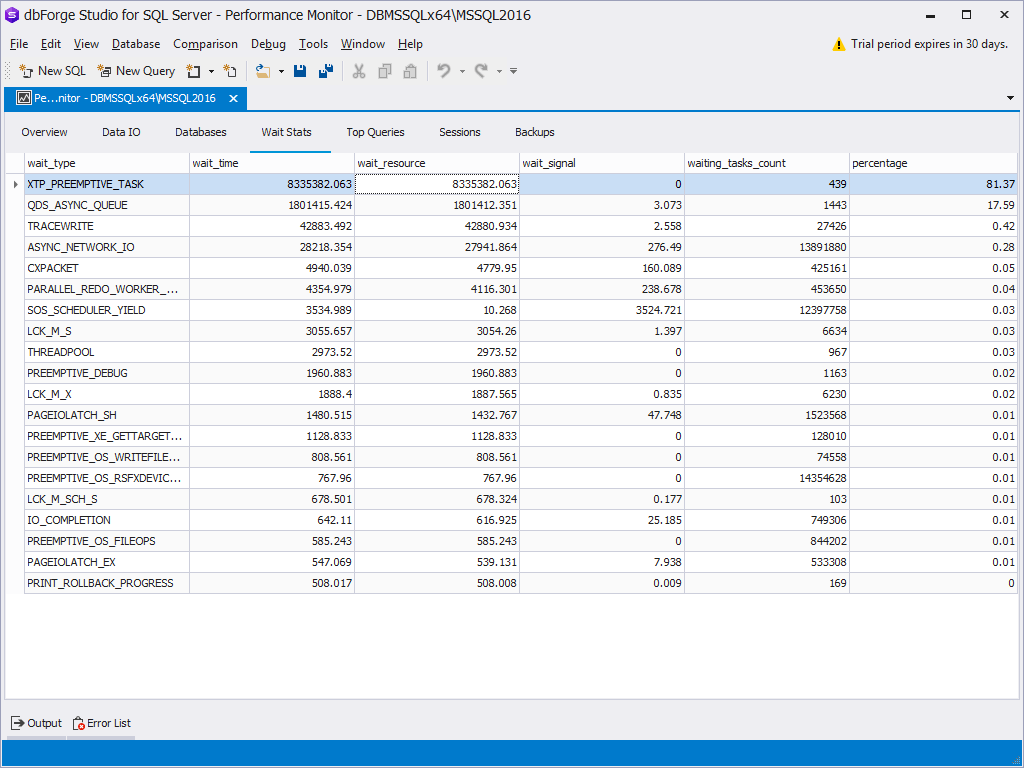
*Wait Statistics The Wait Stats tab, you can identify the resources that slow down the server. It shows the list of waiting tasks encountered by execution threads because resources required for the request fulfillment were busy or not available.

*Top Queries dbForge Monitor includes an SQL query performance analyzer that allows you to detect and optimize the most expensive queries that overload the system. Apart from the list of the poorly performing queries, the tool shows the query text and query profiling data that can help you to rewrite a query in the most productive way.

dbMonitor
dbMonitor

Show more categories

Customer Reviews

dbMonitor Reviews

Prasoon K.

Advanced user of dbMonitor
★★★★★
This is the best database monitoring tool. Highly recommending to use in any industry.

What do you like best?

There is a long list, starting from the ability to filter events by SQL or by description or status and so on, able to trace SQL session and debug the error and the new version has remote debugging. The UI of this tool is very neat and easy to navigate. I don't know whether I have the option to change the theme of the product or not if not then adding this feature will be a good addon.

What do you dislike?

There is nothing to dislike, however, I never tried this tool over cloud configuration- AWS. For Oracle, it would be good if there should be an option to generate AWR report with a click of a button after proving time range.

Recommendations to others considering the product:

This is very nice tool which can help you to find the problem in your database and able to visualize the data flow. Highly recommended to use in the production environment to scale up your database performance. One suggestion as please publish some documentation on how to check and monitor connection pool size and ability to flush via this tool. This will help all of us to flush some unreleased connections which might be lift out via an application.

What problems are you solving with the product? What benefits have you realized?

This tool is helping me to find and debug SQL error for the live session, which also helps me to scale the application accordingly. Also, I am using this tool to find out schema details of very old application data architecture.

Review source: G2.com

Leave a reply

Your total score

B2B Software Guide