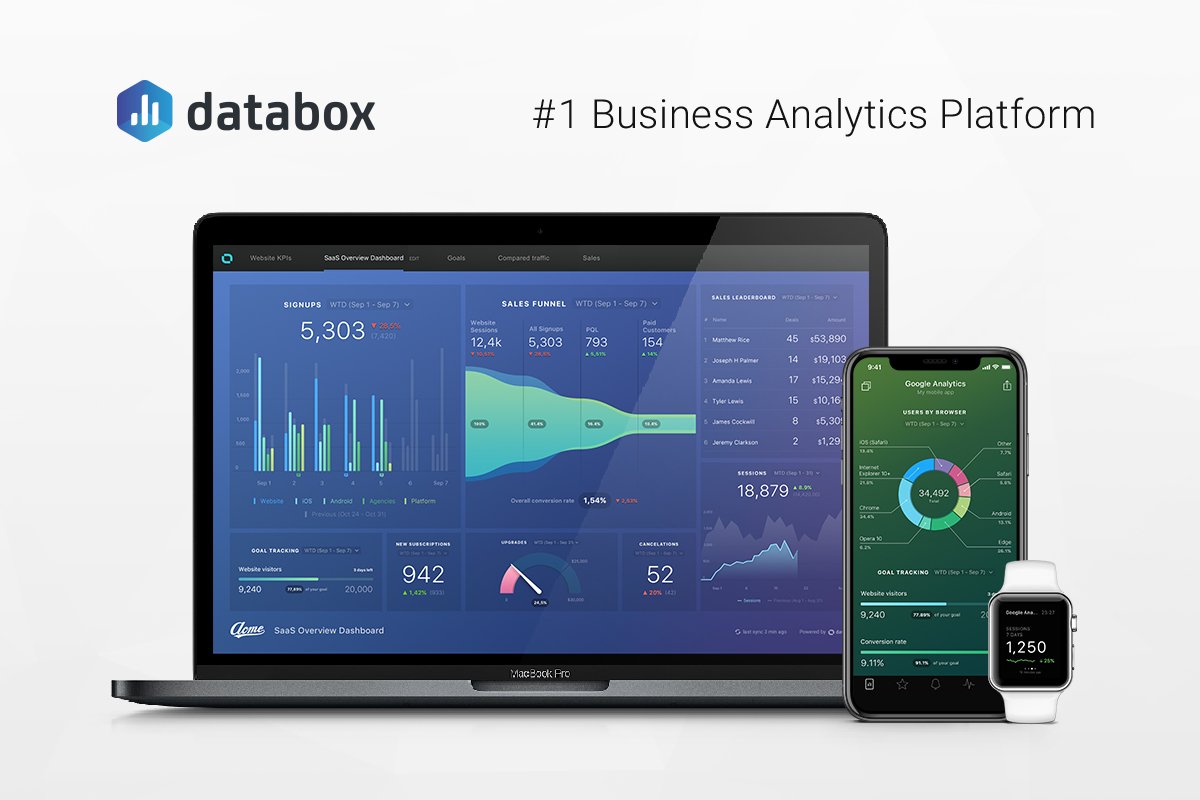
Connect all of your data in one place, visualize performance trends, monitor progress toward your goals, make more informed decisions, collaborate and report as you go with custom views and deep-dives for each function in your organization.
Databox helps you to track the performance of your company, teams and individuals anytime and anywhere. Use Goals, Alerts and Scorecards to easily stay up-to-date on the most important metrics.
70+ ONE-CLICK INTEGRATIONS
The easiest way to connect your data with Databox is through any of our 65+ one-click integrations. These integrations come loaded with thousands of default metrics, as well as hundreds of pre-configured Datablocks andВ over 200 pre-built reports. Connect your account and instantly view the most important metrics.
You can even build custom metrics with filters by usingВ Query Builder to pull more granular performance insights.
GOAL TRACKING
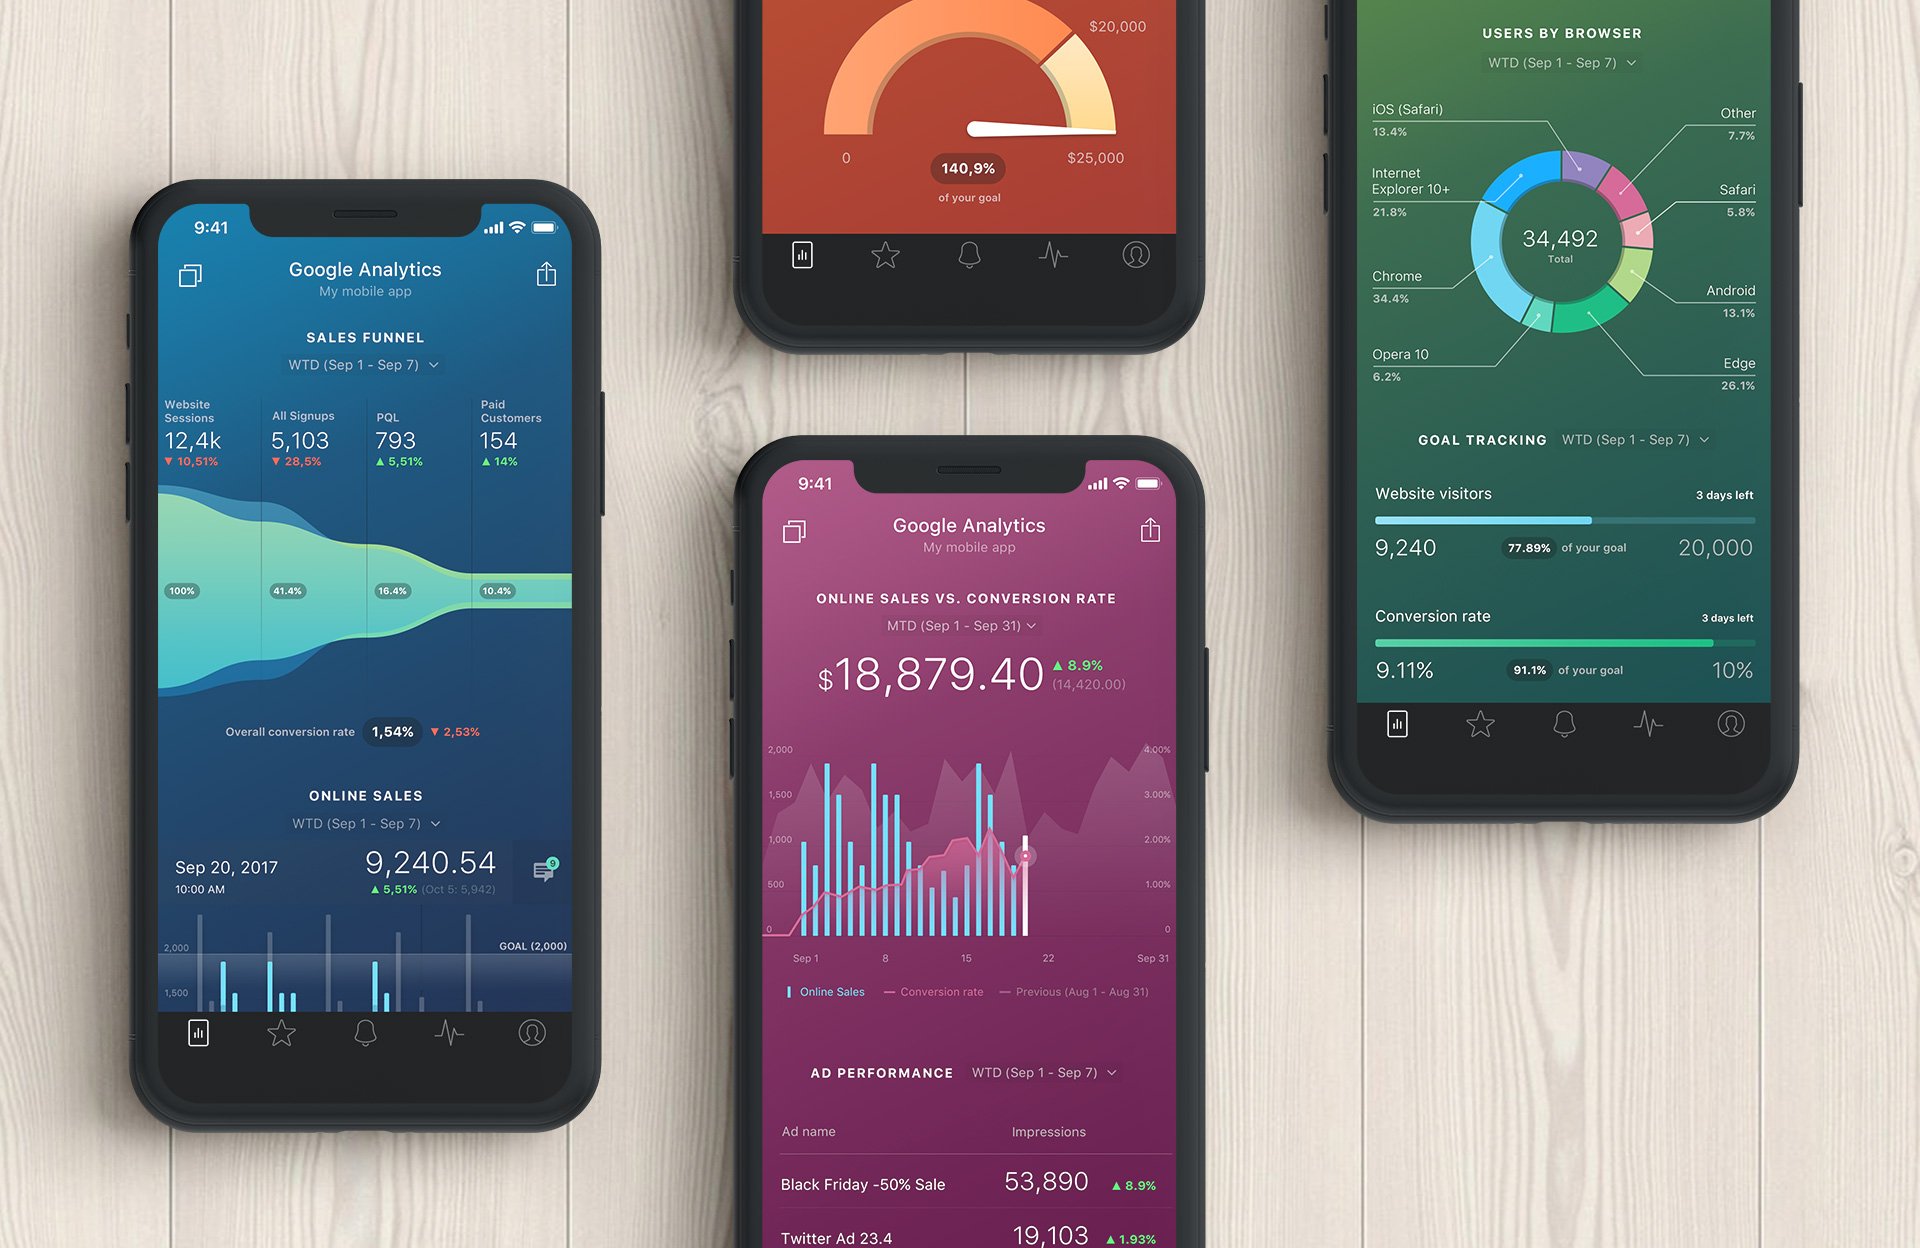
Set, assign, and monitor progress toward SMART Goals on one screen so everyone knows how your company is performing.
DAILY AND WEEKLY SCORECARDS
Scorecards send you updates on your most important KPIs through email, mobile push notification, and/or Slack every day, week, or month.
ALERTS & INSIGHTS
Get notified when performance is off and don’t wait until the end of the month or quarter to know how your performance is trending.
With Insights, see a stream of your team’s achievements and receive recommendations for improving your performance.
CALCULATE METRICS
Combine data from any source and easily calculate new metrics, conversion rates, ROI, and much more — all without coding or spreadsheets.
Whether you’re viewing from your desktop, phone, TV, or even your wrist – Databox is optimized for wherever business takes you.


