amCharts is a set of programming libraries and tools for all your data visualization needs on the web.
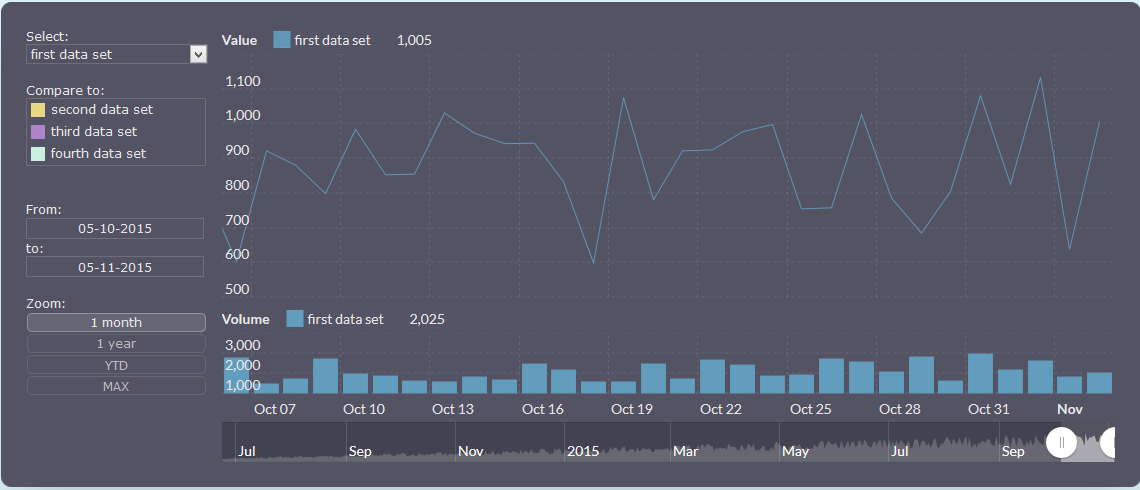
amCharts JavaScript product lineup includes classic charts like Line, Area, Column, Bar, Pie, XY, Scatter, Candlestick and OHLC as well as more “exotic” ones like Gauges, Funnels, GANTT, Stock Chart to display large amounts of financial and other date-based data, and fully interactive adaptive world or local country maps. Fully functional products are available for free (with a small backlink) for any type of use, as well as in paid commercial form for all kinds of usage scenarios.


