YCharts is an investment research platform that enables smarter investments and better client communications, serving a client base of more than 5,000 RIAs, financial planners, and asset managers who oversee more than $750 billion in assets. YCharts helps investing professionals easily demonstrate their value to clients and prospects with tools that enhance client engagements and simplify often complex financial topics using visuals.
A leading financial research platform, YCharts offers comprehensive data, powerful visualization tools, and advanced analytics for equity, mutual fund, and ETF data and analysis. As a modern, user-friendly platform for security research, portfolio construction, idea generation, and market monitoring, YCharts enables vast time savings and serves as an affordable alternative to terminal-based tools.
For more information, start a free trial via ycharts.com, contact [email protected], or follow us on Twitter at @ycharts.
Zach A.
Advanced user of YCharts
★★★★★
Leverage a simple UI for Fundamental Research
What do you like best?
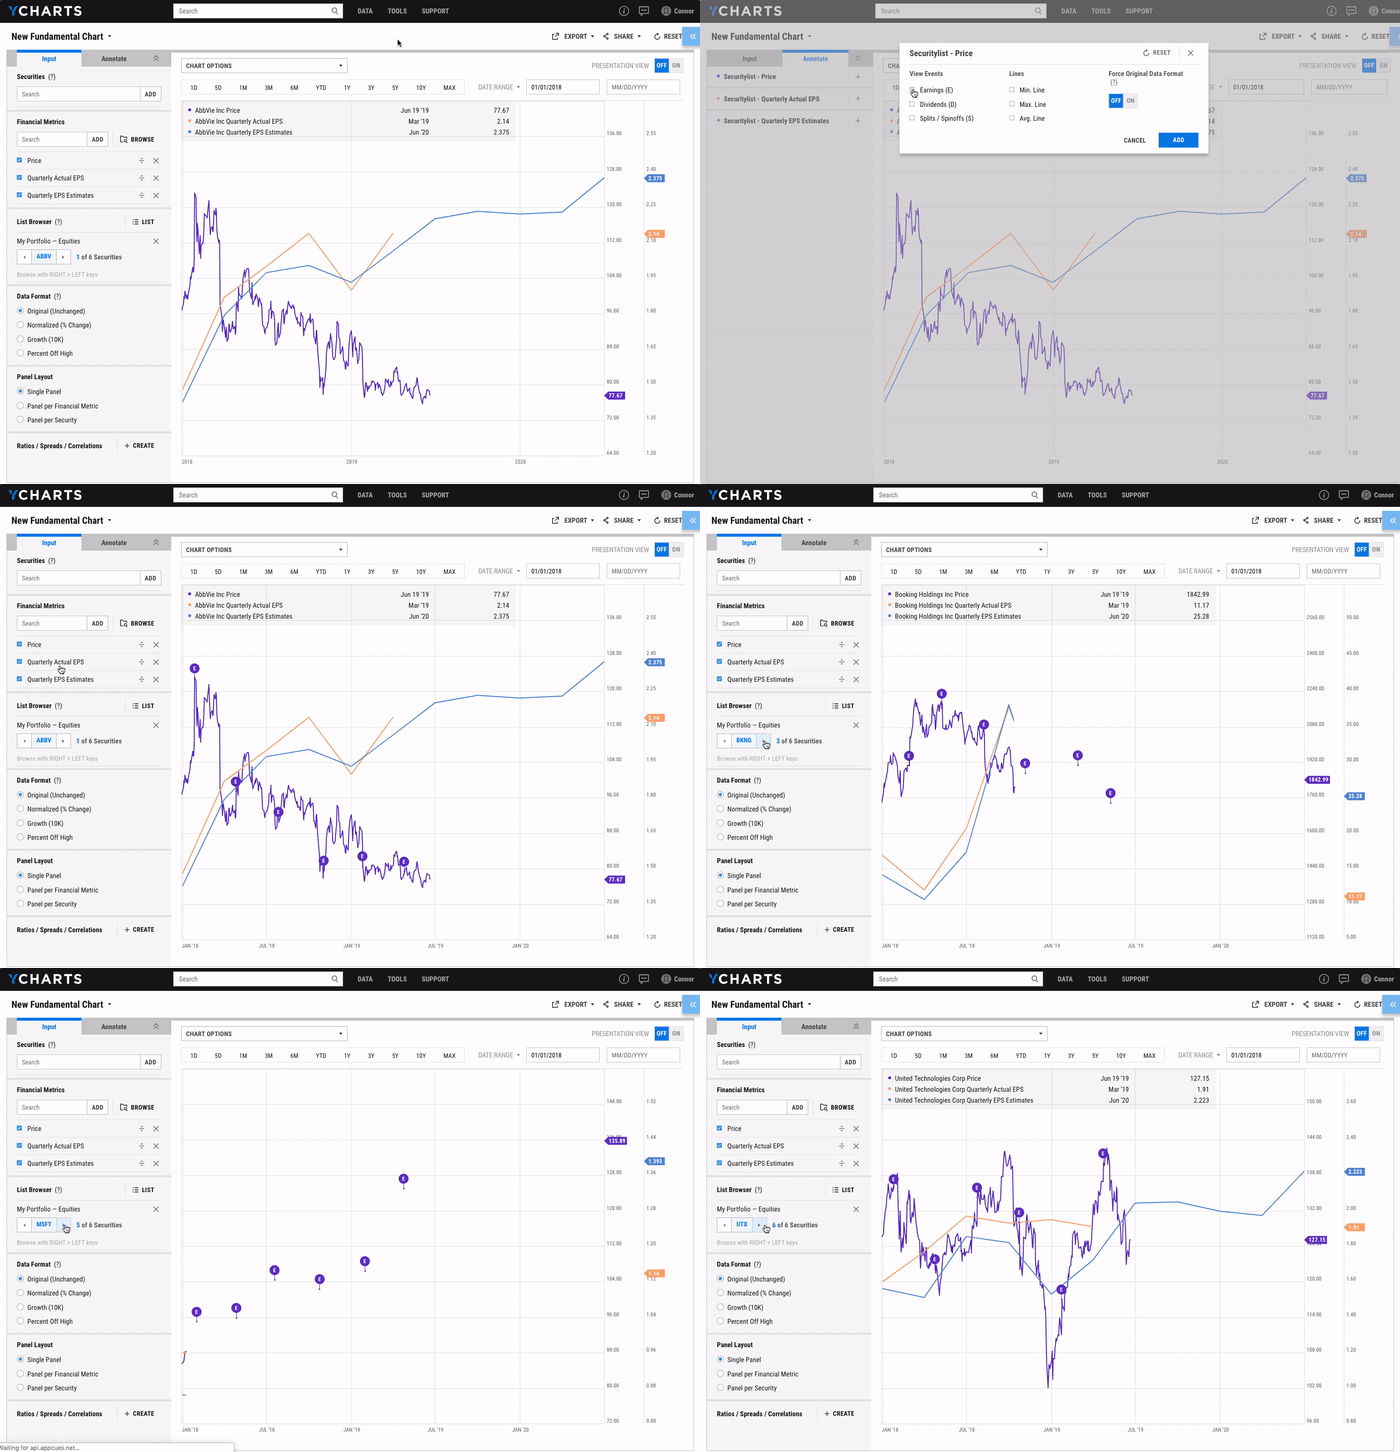
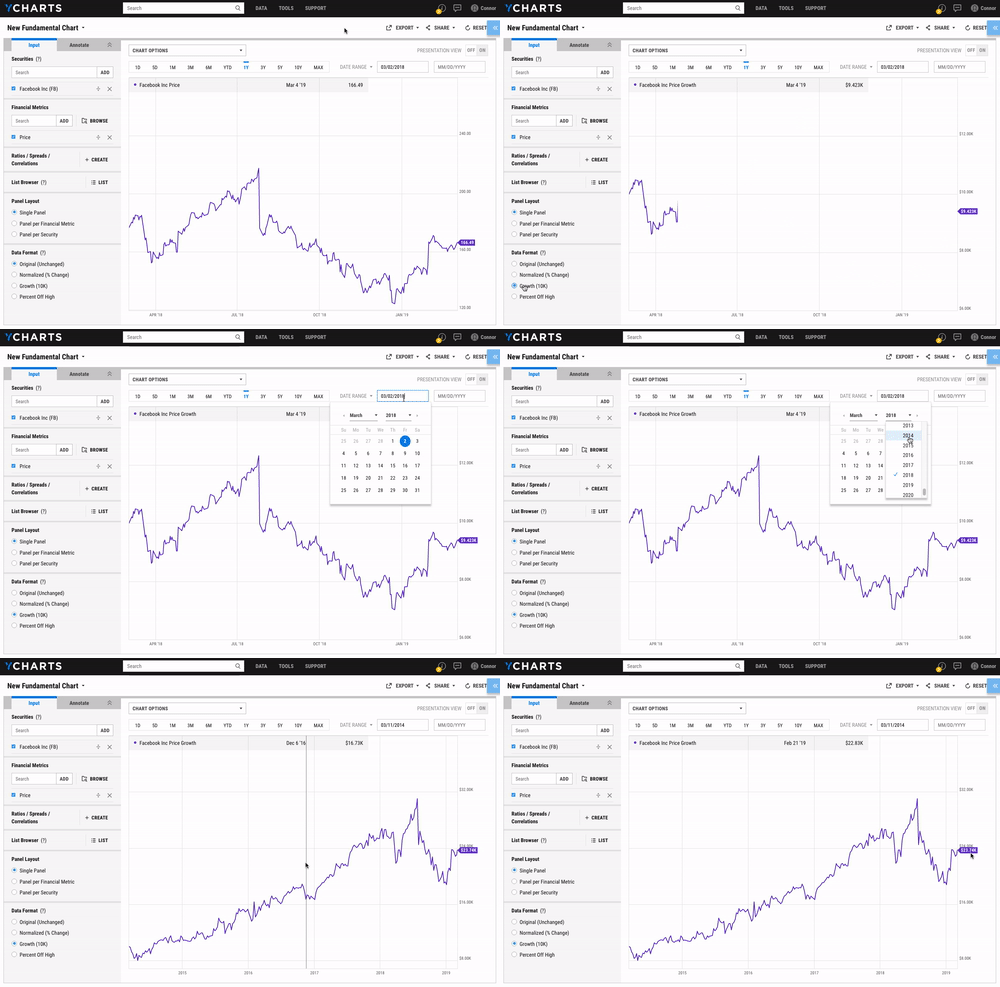
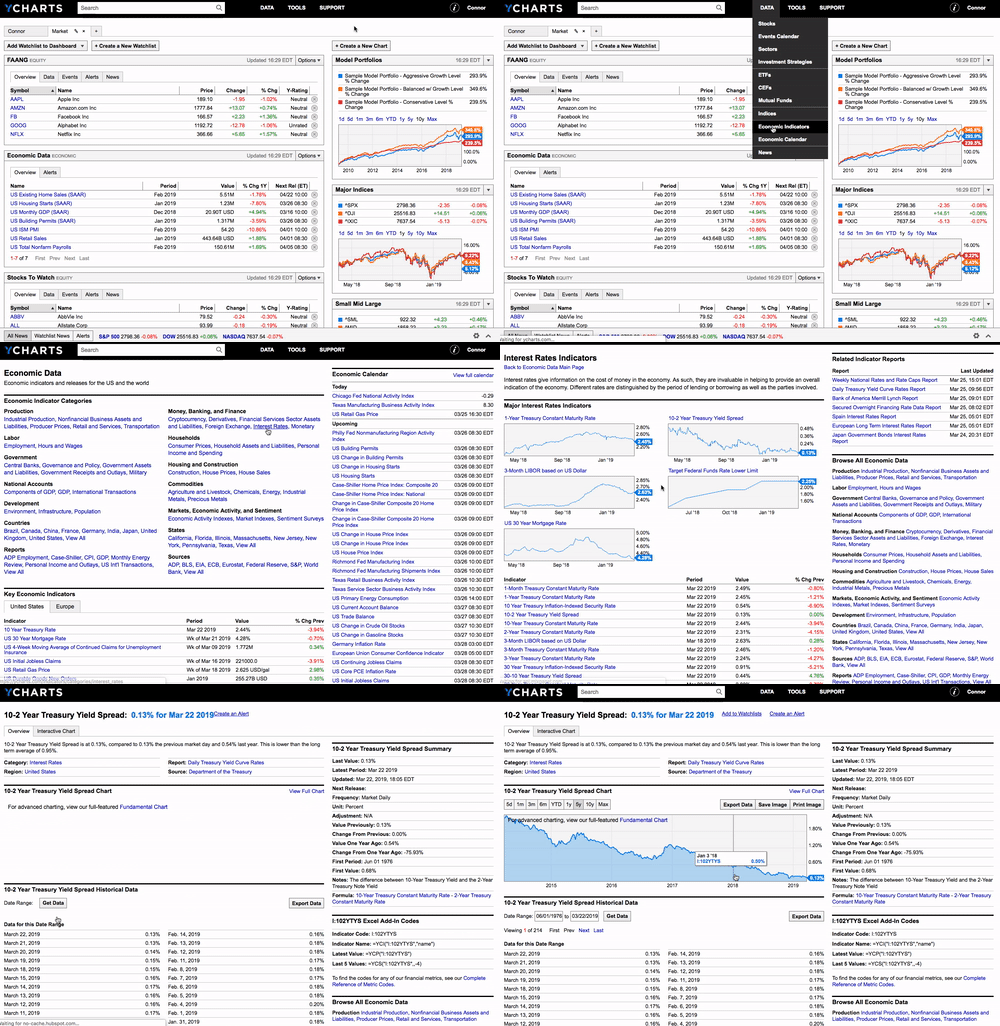
The best part of YCharts is it's simplicity and fundamentals charting. Gaining insight into financial information is easy because of the charting capabilities. YCharts allows users to chart any fundamental against any timeframe and equity. I like that economic data is readily available.
The screening tool is nice because you can build equations into the tool and filter. The tool is flexible and allows the user to screen almost any combination of financial parameters in a simple way.
The service excels at helping you cut out the noise to see underlying financial metrics, how they relate, and how you can execute.
What do you dislike?
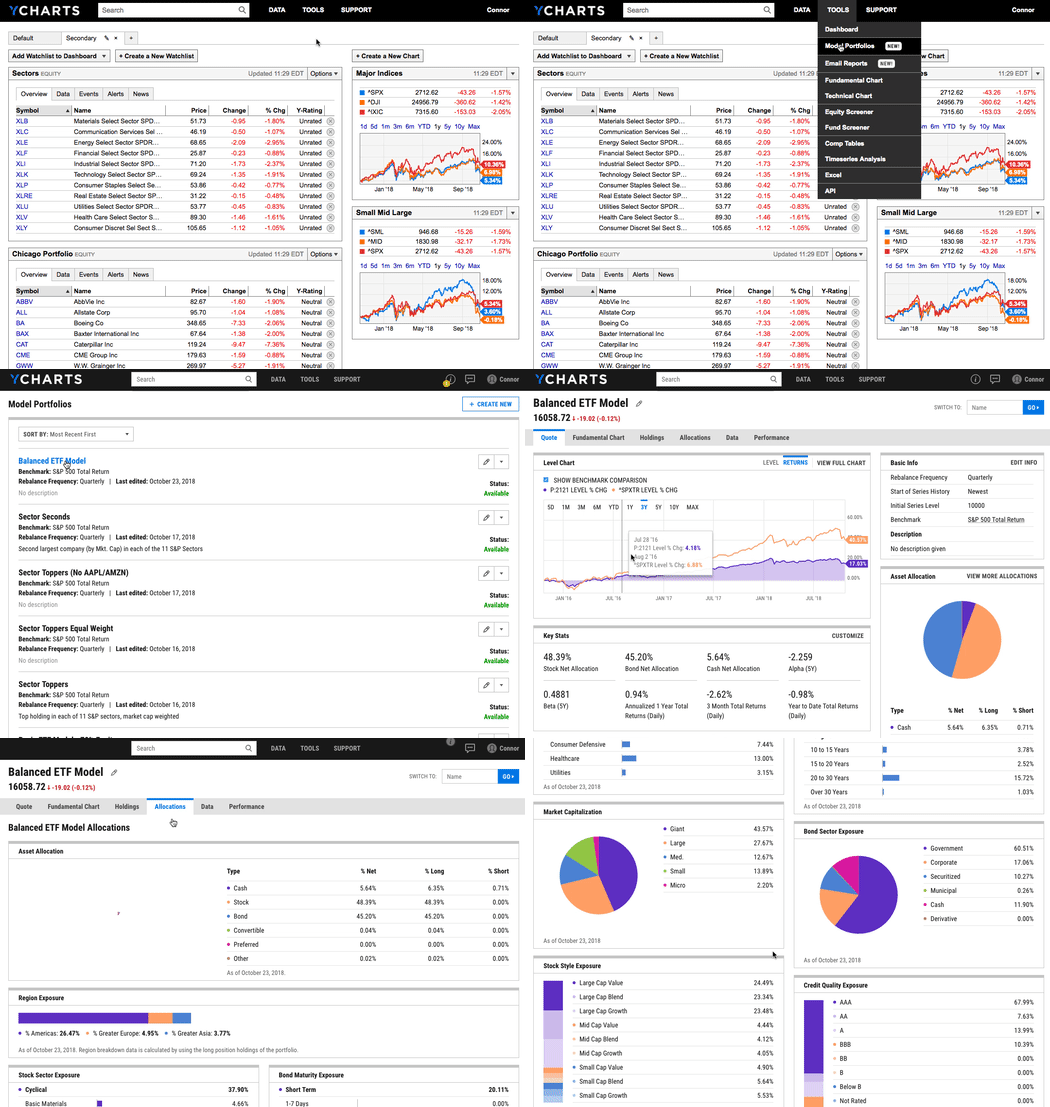
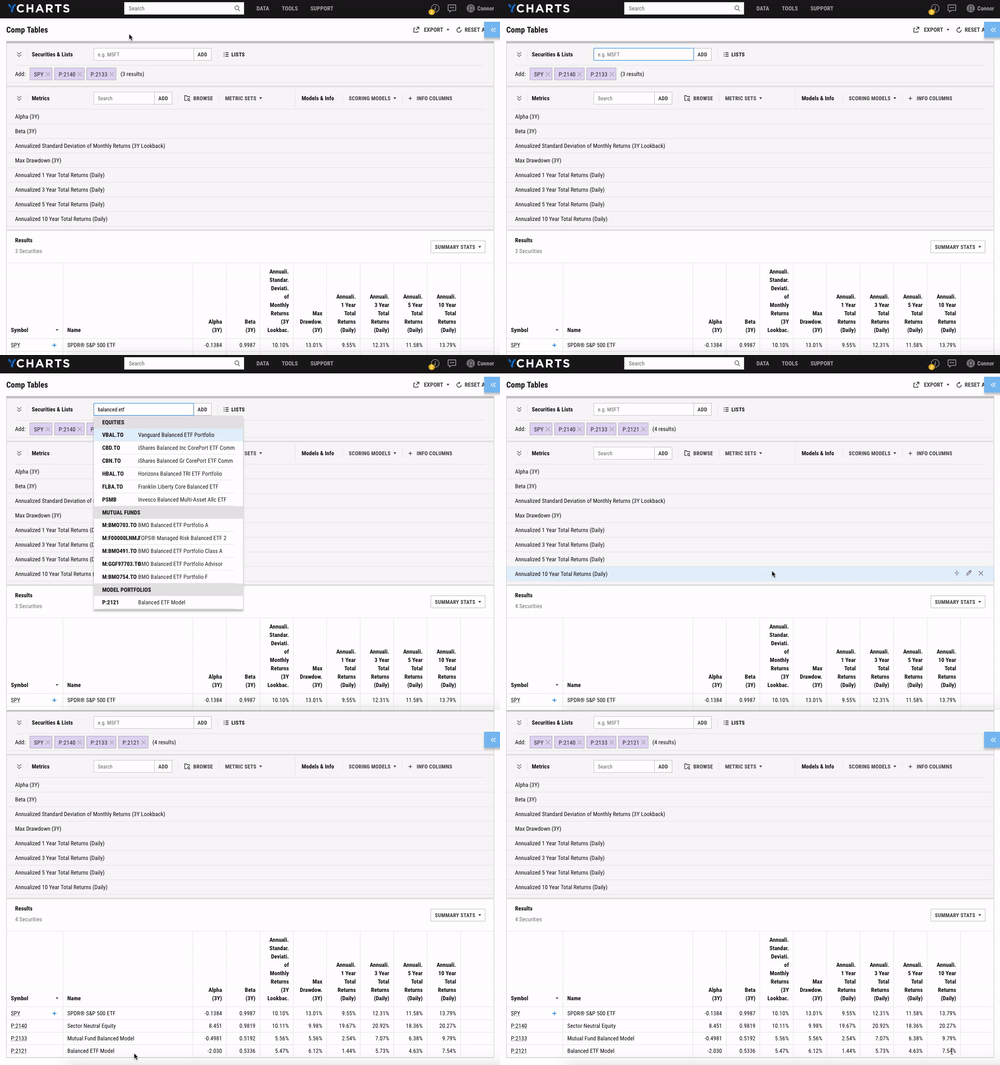
While YCharts is robust, I dislike that the comp tables and timeseries are a separate service. It seems these a la carte offerings are separated for no real reason. The time series table is just a compilation of data that is already available in the screener, so why break this out? Also, the service is on the expensive end of the spectrum. I also wish there was some sort of API at this price point, there isn't that I know of.
What problems are you solving with the product? What benefits have you realized?
Consolidating all my fundamental financial research into one product. Screening on a combination of financial parameters using equations in the tool. Economic indicators are an extra layer of benefit.
Review source: G2.com


