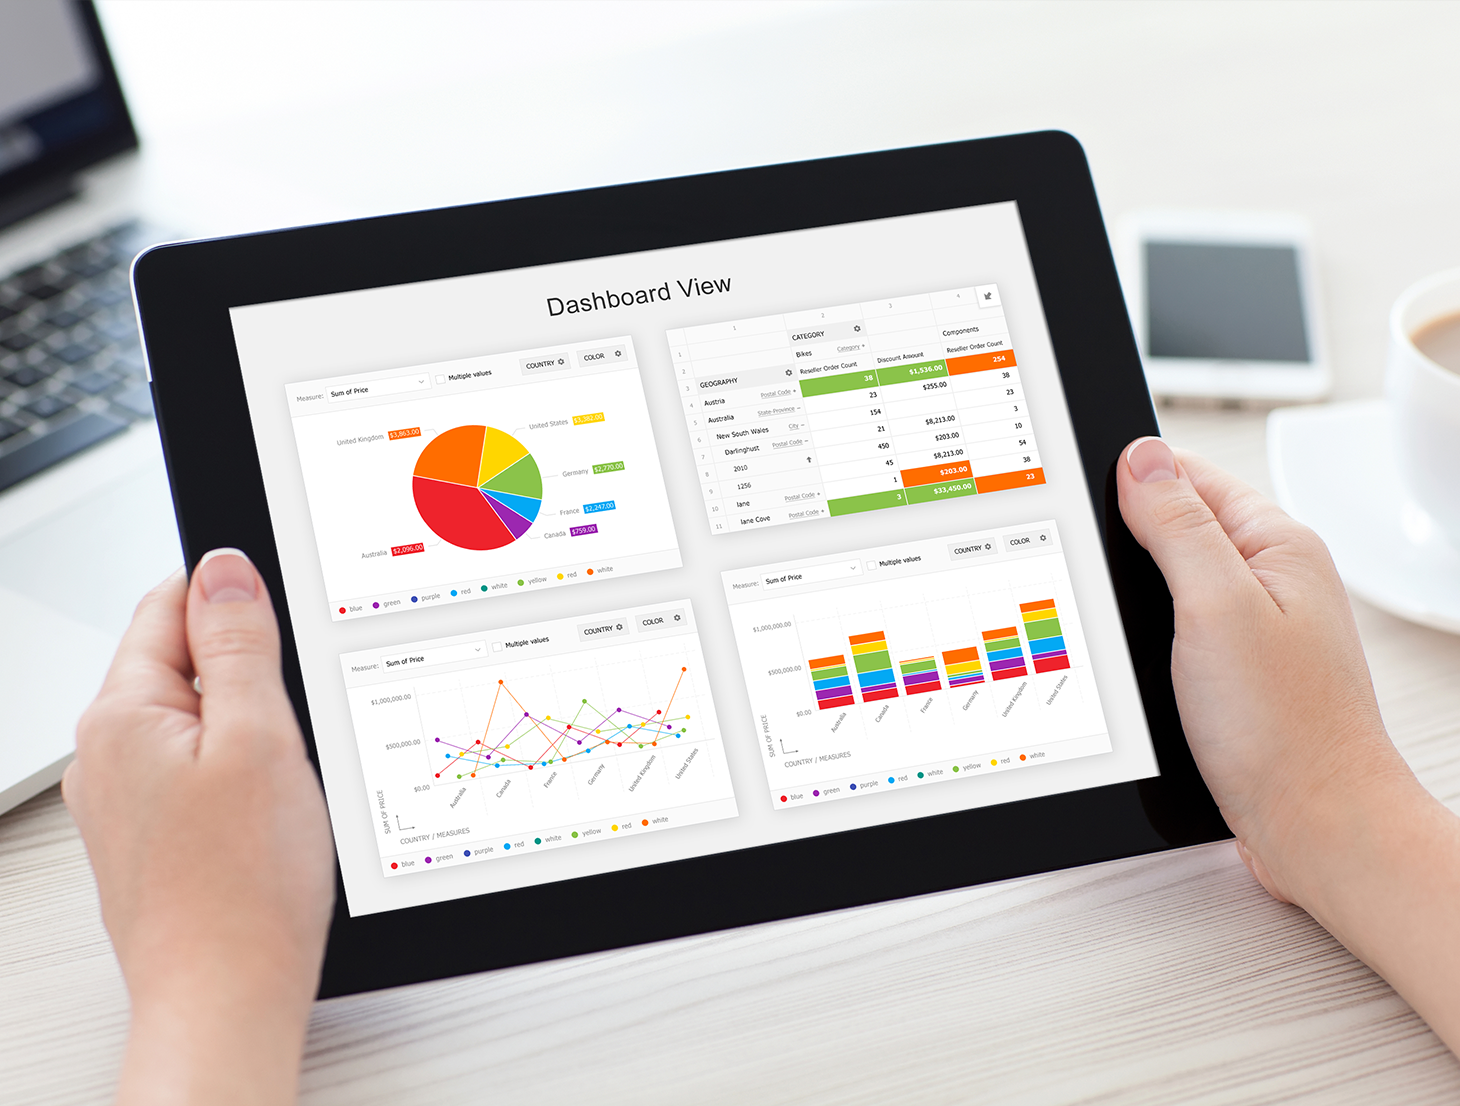
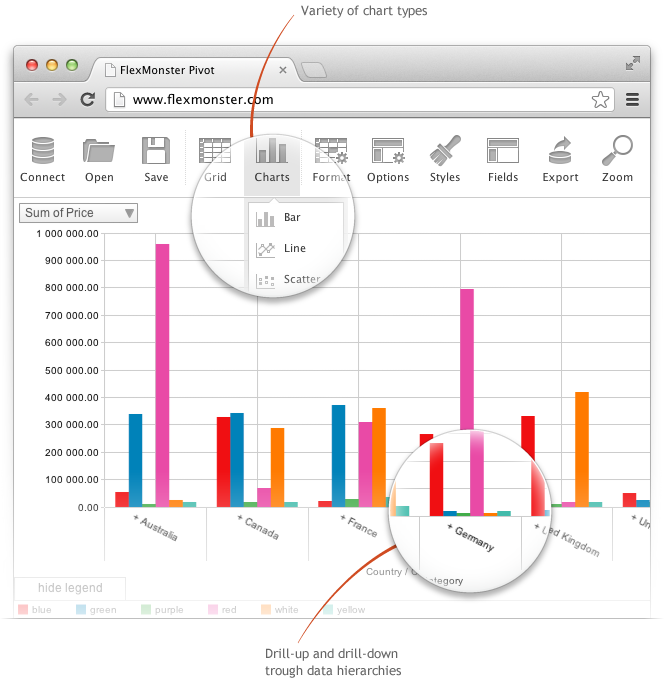
The Flexmonster Pivot Table & Charts Component allows users to easily create pivot tables and pivot charts.
– Easy to integrate: can be natively used with JavaScript or TypeScript and perfectly integrates with client side frameworks such as AngularJS, Angular 2, React, RequireJS as good as with the server side like ASP.NET, Java JSP and others.
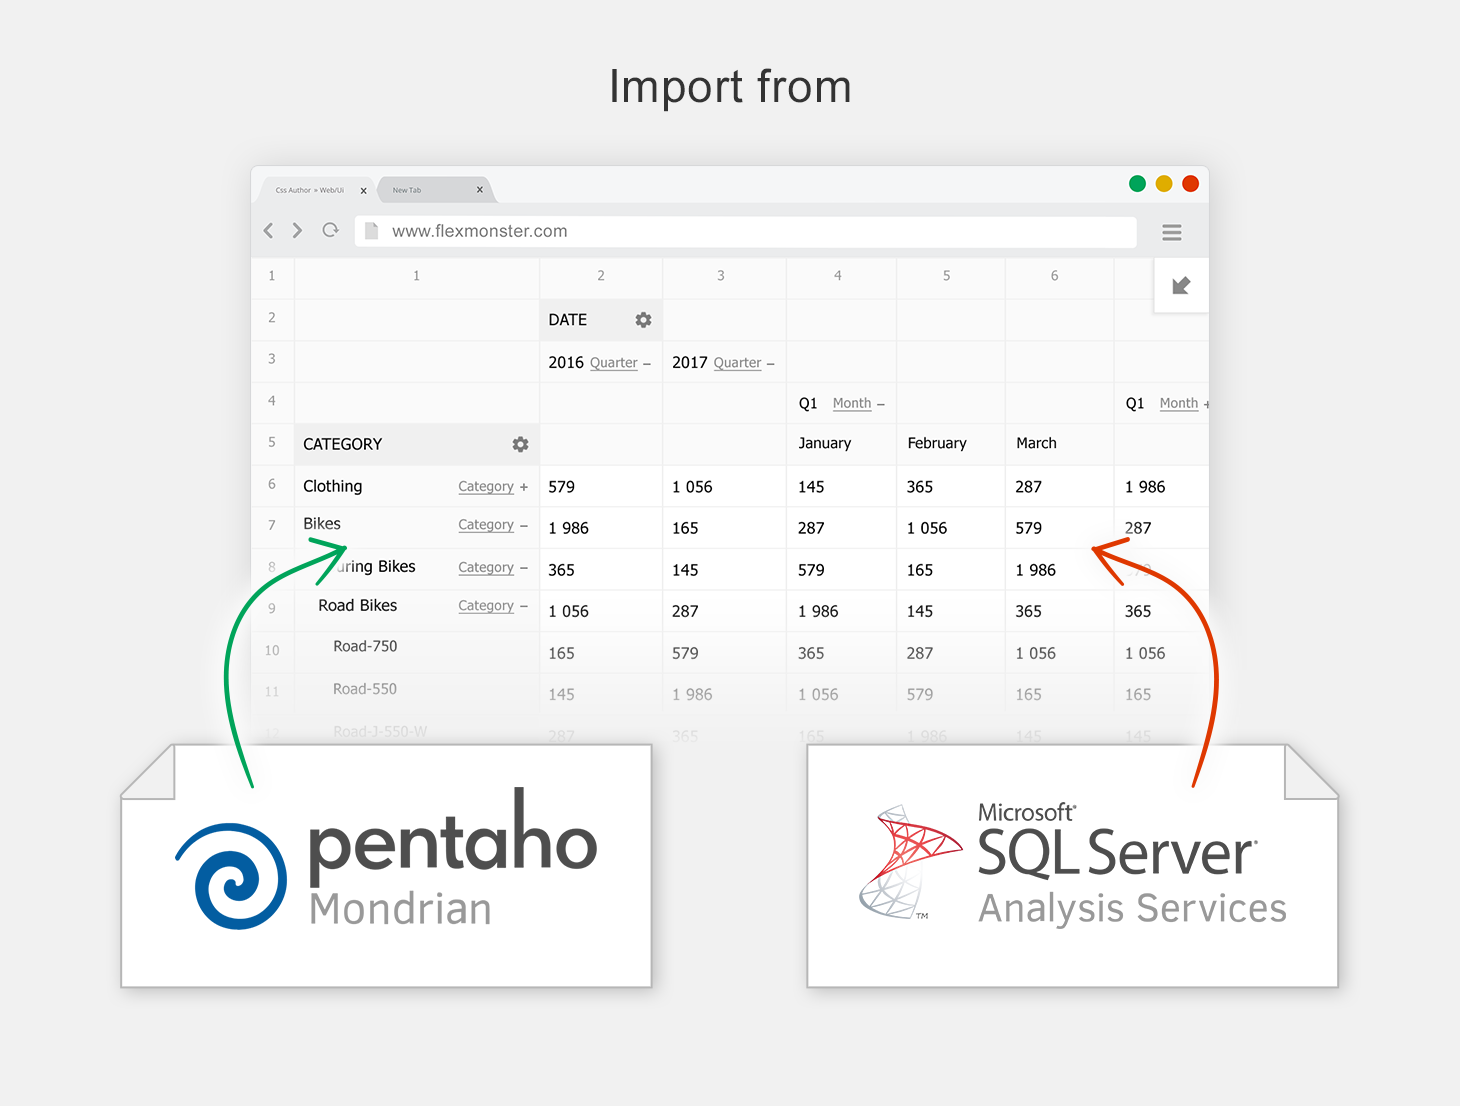
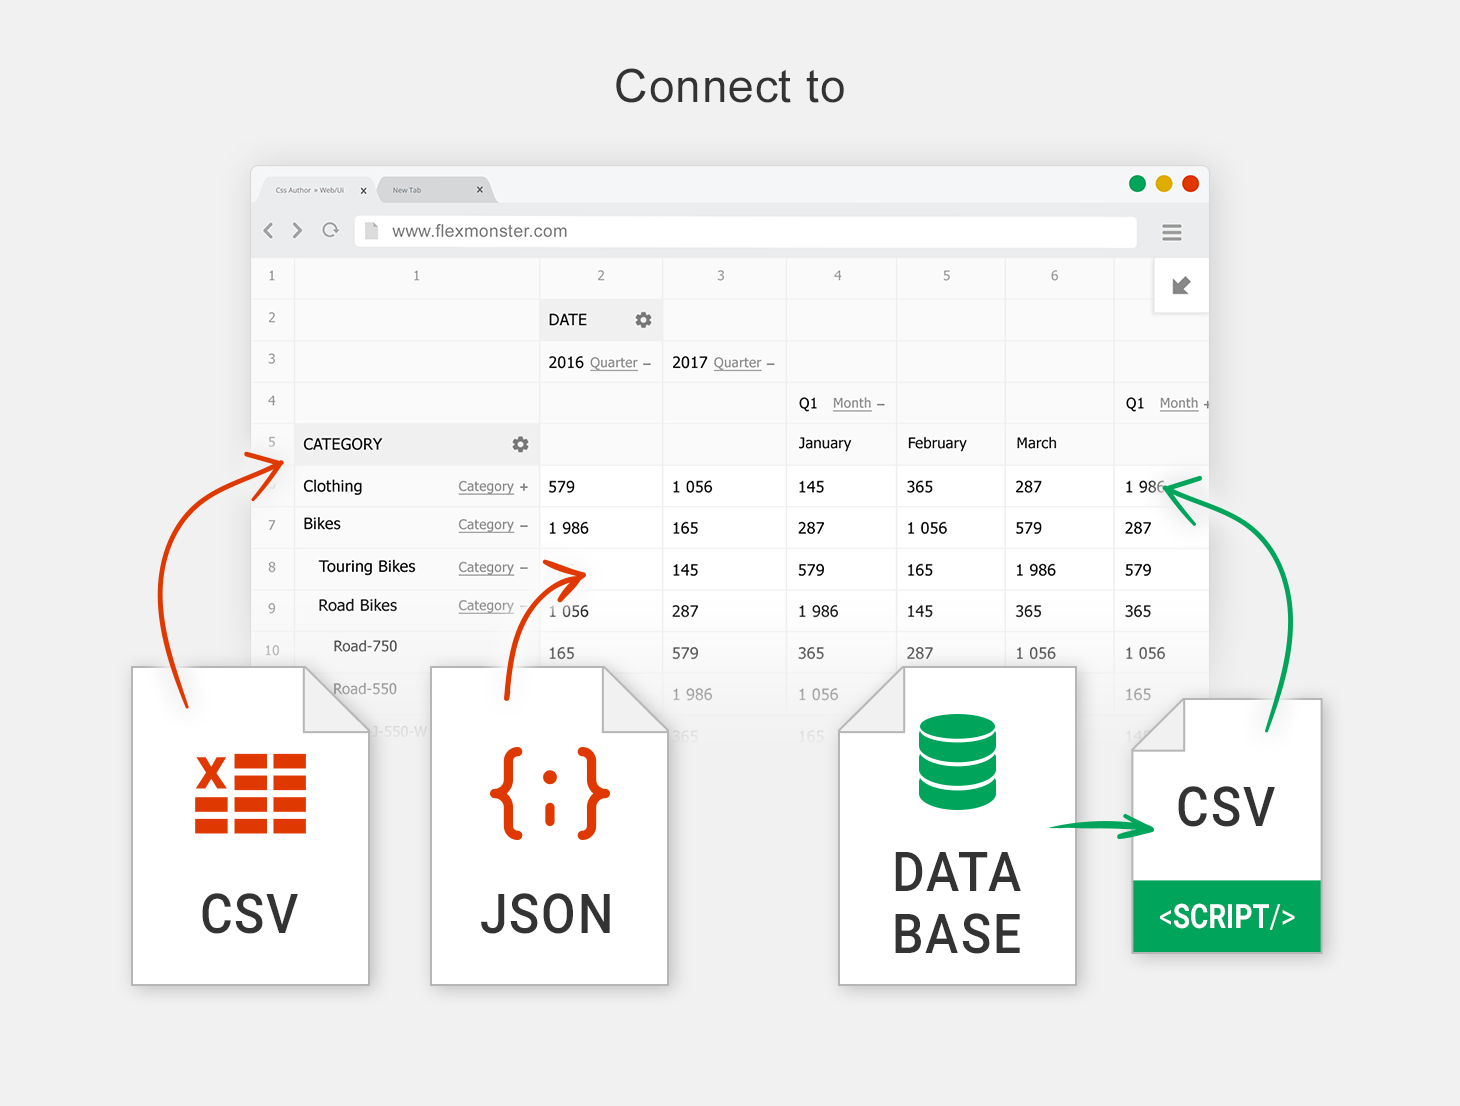
– Supports the most common data sources: Microsoft Analysis Services, OLAP cubes, Mondrian, icCube, JSON, SQL (MS SQL, MySQL and others) databases, static CSV files.
– Allows you to work extremely fast with really large data volumes (huge OLAP cubes, data sets from SQL DBs or files up to 100 MB).
– No limitation on the server-side technology, no matter whether your website runs on .NET, Java, PHP, Ruby, etc.
– Fully customizable with JavaScript API.
Pivot Component provides Excel-like features which give users the interface they have always been used to. The users can easily and quickly analyze data and produce a report using different options.
Flexmonster Pivot Table & Charts Component
Kembria P.
Advanced user of Flexmonster Pivot Table & Charts Component
★★★★★
Amazing for Pivot charts and tables.
What do you like best?
FlexMonster is one the best tool to get accurate and proper pivot tables and pivot charts. The best part of this tool is its speed of performing its job. Even if you are working in very large volumes, it will provide you with accurate and awesome tables and charts in no time. FlexMonster can extract data itself from the common data sources like MS Analysis Services, JSON, SQL tools and databases. Another amazing part of this tool is its integration your system. It supports almost all programming languages but the best fit in is JavaScript. It is highly customizable with JavaScript API, which makes it more convenient for the users to understand they can easily customize the things they want to appear on their dashboards and can use them properly without any hectic routine of finding the tool icons with the software. The user interface of FlexMonster is more like of MS excel which makes it more easier for the users as almost all of them are always familiar to the excel. Flex Monster's ability to create 1-click report is so amazing. It can easily be integrated into to the webpages or web apps. It works amazingly on both desktop browser applications and mobile applications whether they are iOS or android.
What do you dislike?
One of the major drawback of this tool is its worth. It is quite expensive for the new organizations, which are new to such tools and want to automate their work. That is why most of professional users avoid this tool because of its price tag.
What problems are you solving with the product? What benefits have you realized?
Overall, it is an amazing tool with many benefits but the price tag point of this tool outshines the pros.
Review source: G2.com


