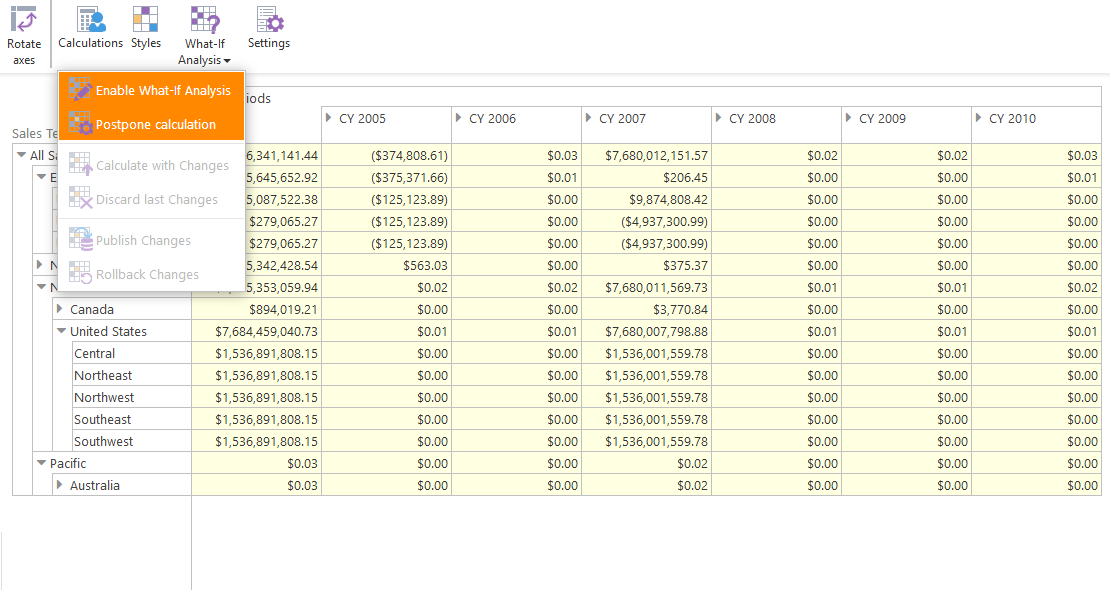
Ranet OLAP Pivot Table provides wide options for multidimensional data analysis. Powerful UI controls for HTML, WPF and Silverlight allow users to create pivot tables and interactive reports by simply and dropping elements in the special designer area, and complex filters allow creating various data slices for analysis.
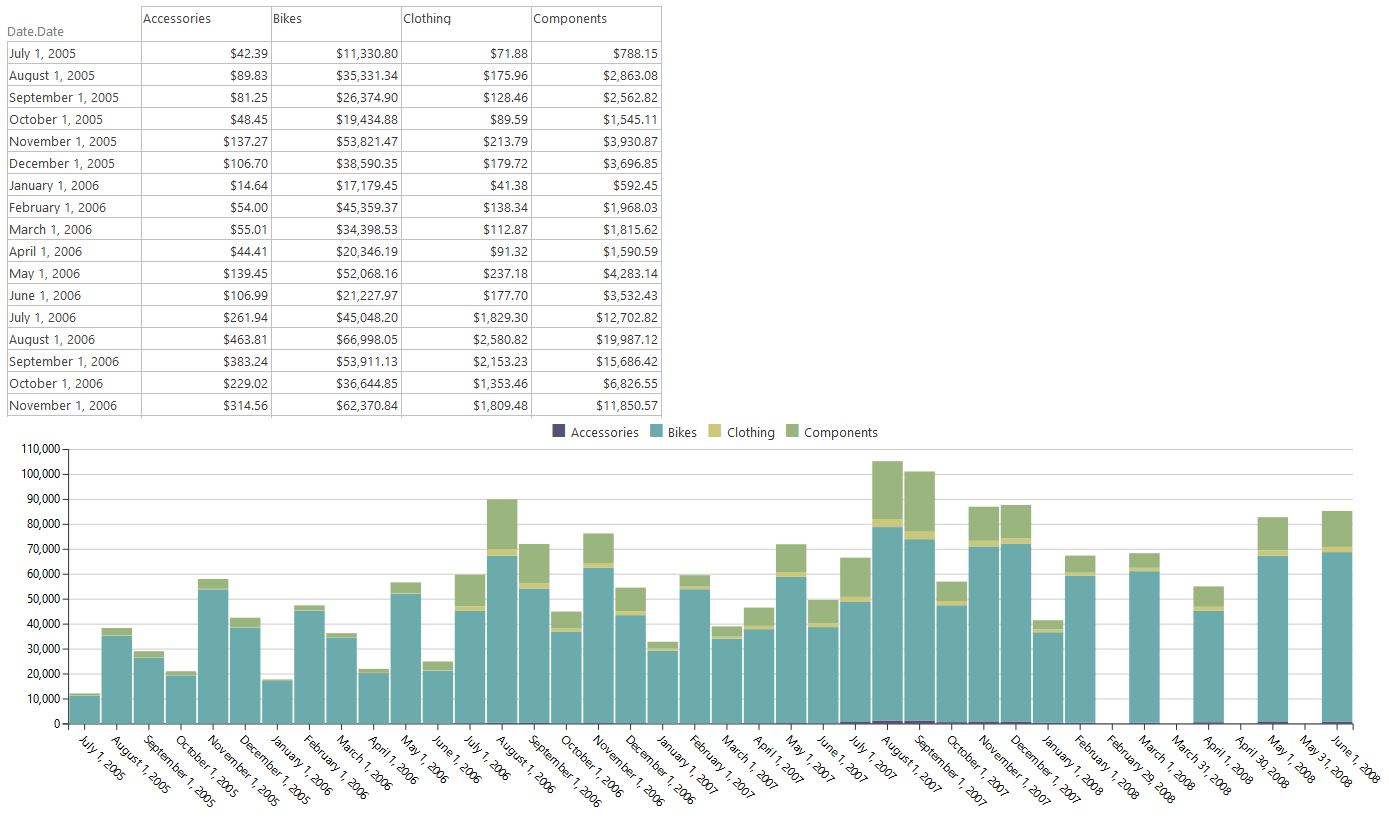
Users can visualize the data on heat maps and data charts, as well as create special chart tables to compare different slices of the pivot table data.
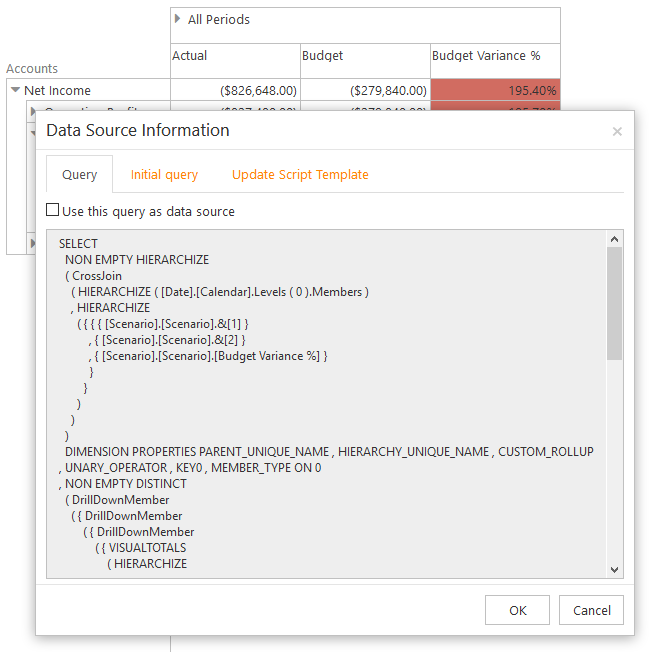
The pivot table works with such data sources as Microsoft Analysis Services, Pentaho Mondrian, Hyperion Essbase, and icCube.


