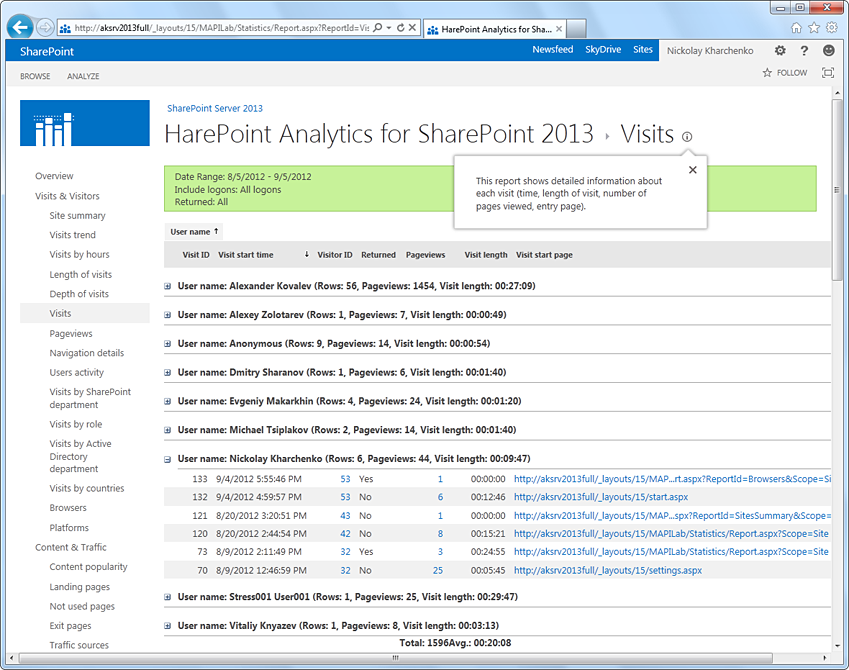
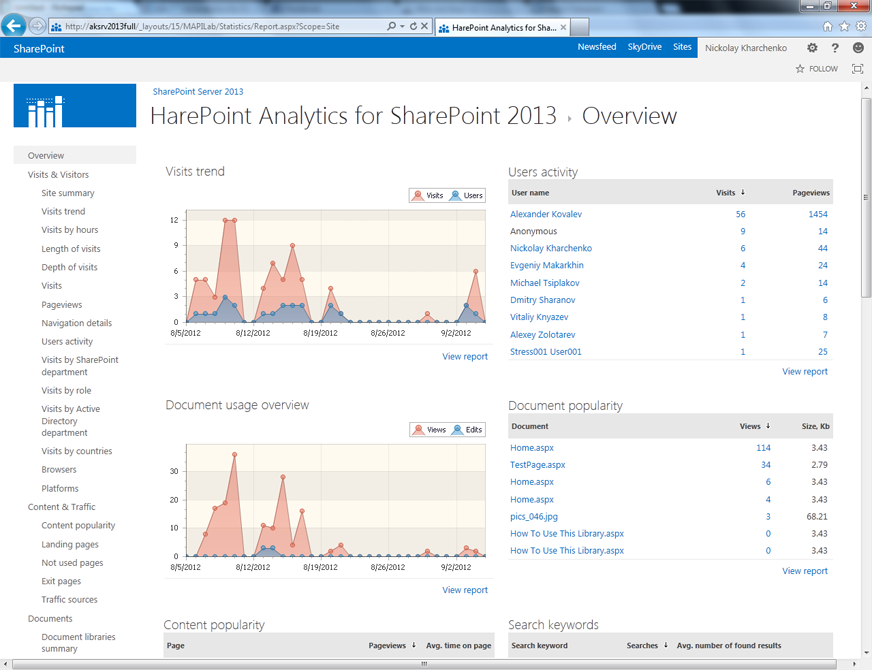
HarePoint Analytics for SharePoint is a solution for web analytics, the source of detailed information on the performance of SharePoint-based portals and websites. Product reports are covering such aspects as users and their behavior; usage of content, documents, list items and search services. The product is a source of essential information on portal usage for IT management, project managers, web editors, business managers and others.
HarePoint Analytics for Microsoft SharePoint
Images
Check Software Images
Customer Reviews
HarePoint Analytics for Microsoft SharePoint Reviews
Abhaya P.
Advanced user of HarePoint Analytics for Microsoft SharePointWhat do you like best?
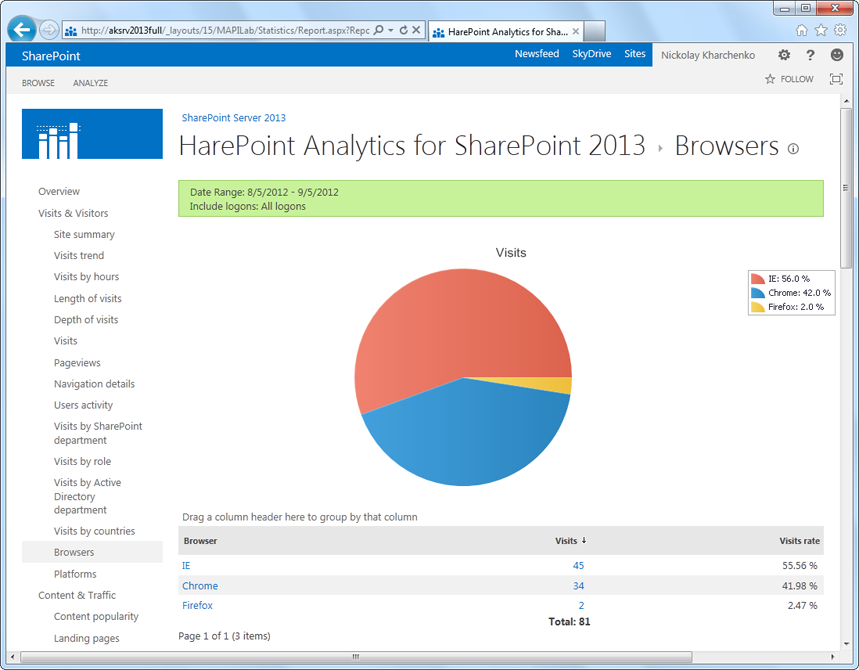
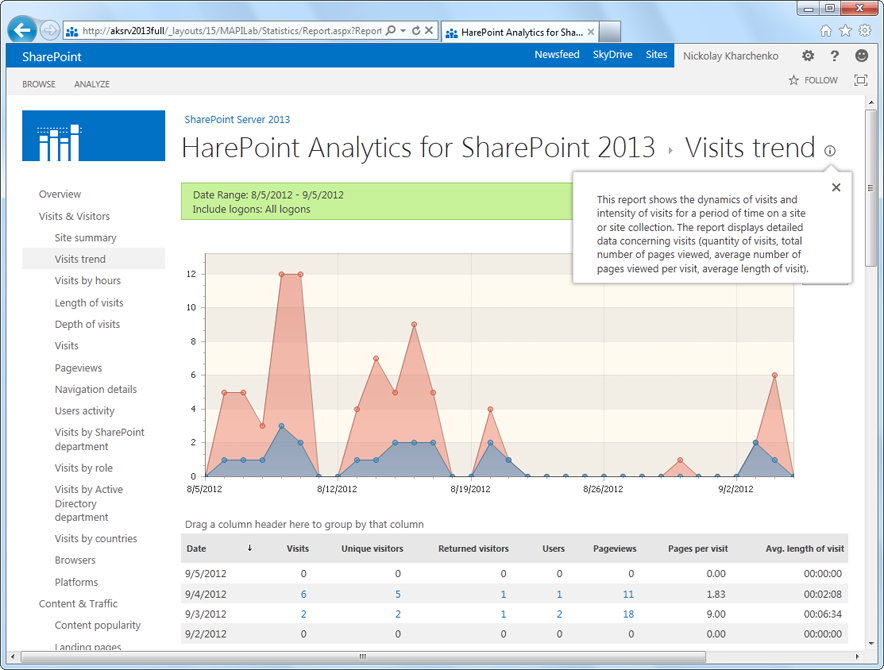
I am very fond of this application since it helps me in analyzing the data and present them in a user readable way such as reports, graphs or charts. These charts which can be easily presented to our customers, stakeholders or any other non-technical person. The application is very easy to use and interactive one.
What do you dislike?
The application is disorganized and some of the features are not so much useful to the end user. Some time, it takes a lot of time to load and open. The charts and tools take a longer time than useful which can be irritating.
Recommendations to others considering the product:
I would like to recommend this tool to everyone since it helps us to represent our data in a more beatuiful way in the form of charts, graphs or pictures by analyzing the data. It makes our work so much simpler and we need not have to depend on other paid tools such as Tableau to present our data in graphs or histograms.
What problems are you solving with the product? What benefits have you realized?
HarePoint Analytics have helped me to present my data to customers and other stakeholders in a graphical form which are easily understood by them. I can also dervice insights out of my data and educate my colleagues who can be either technical or non-technical. It is a wonderful tool to use and I would recommend this to everyone.

