A handy software for data analysis
What do you like best?
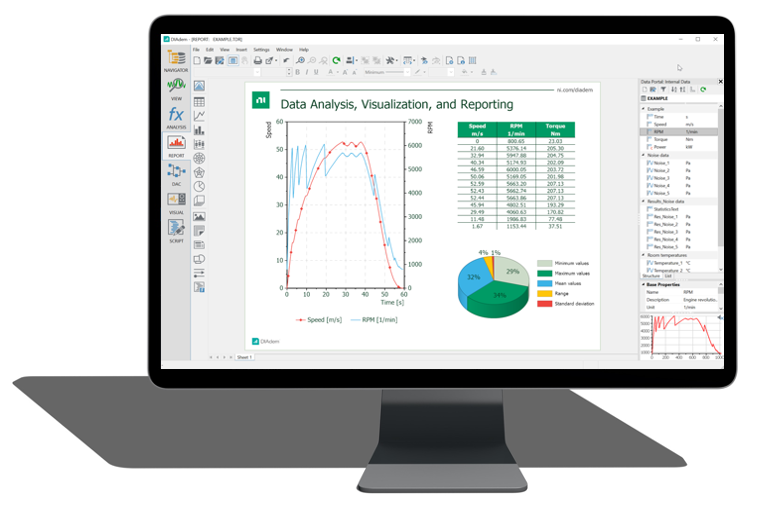
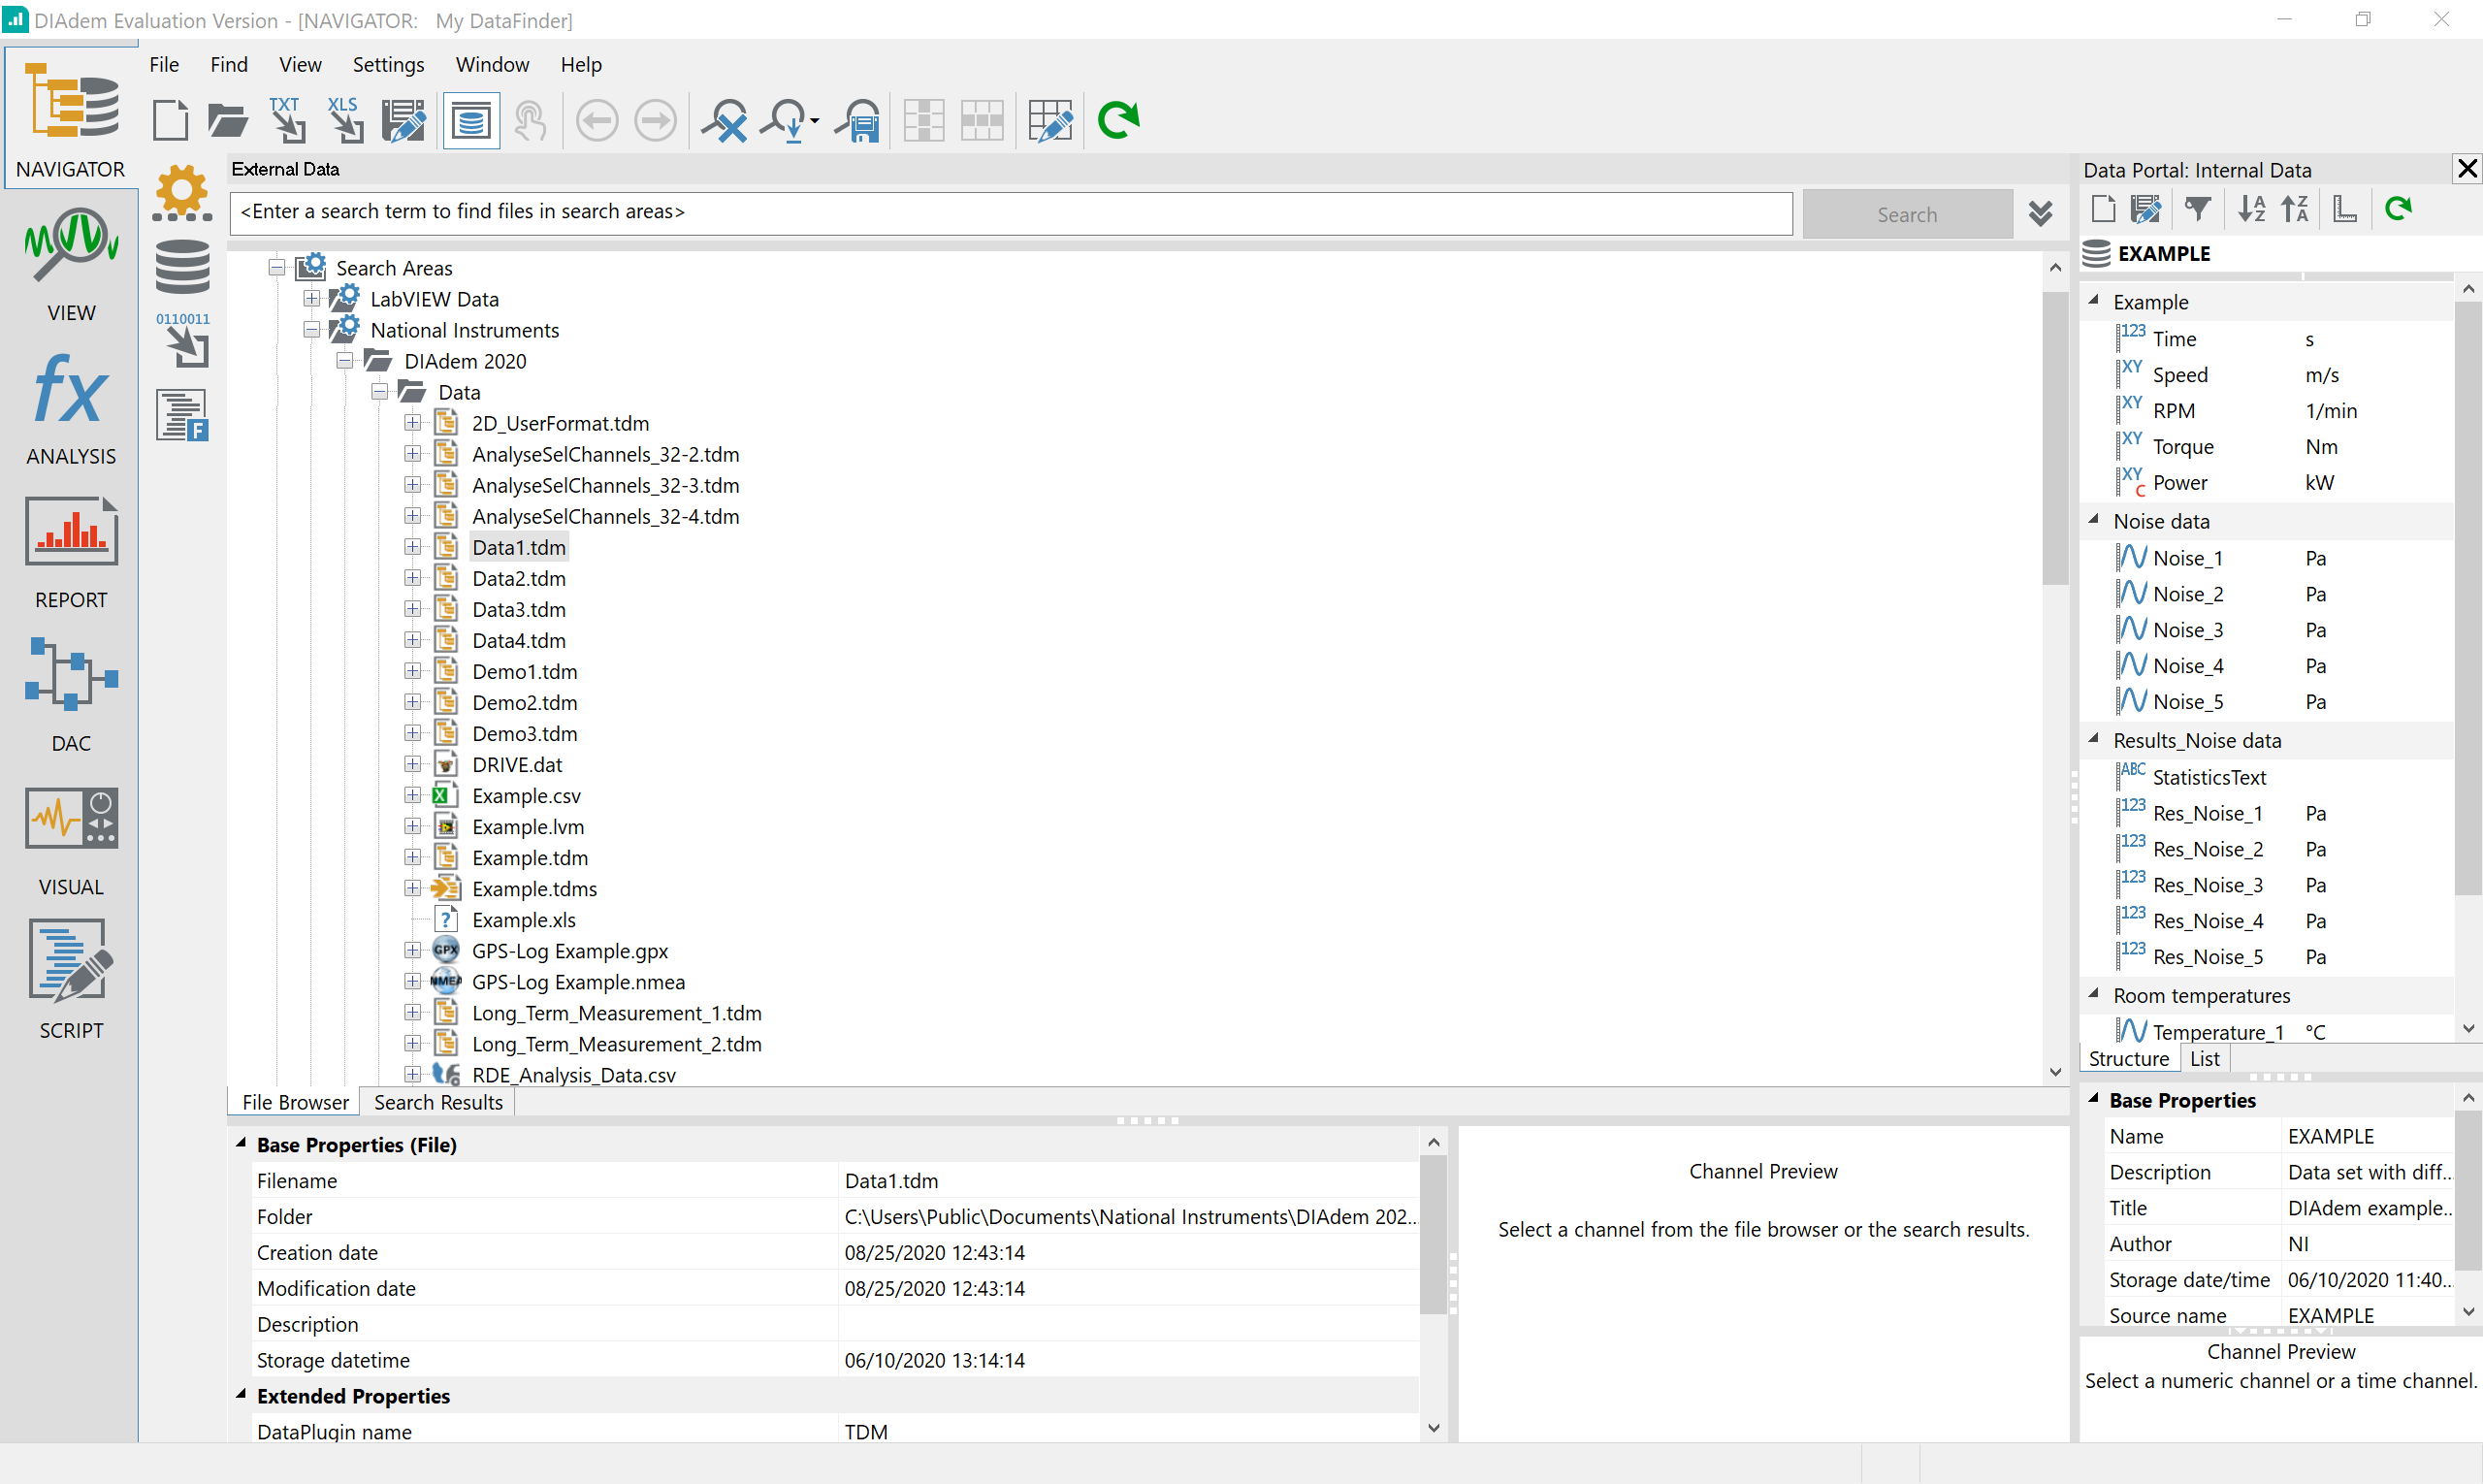
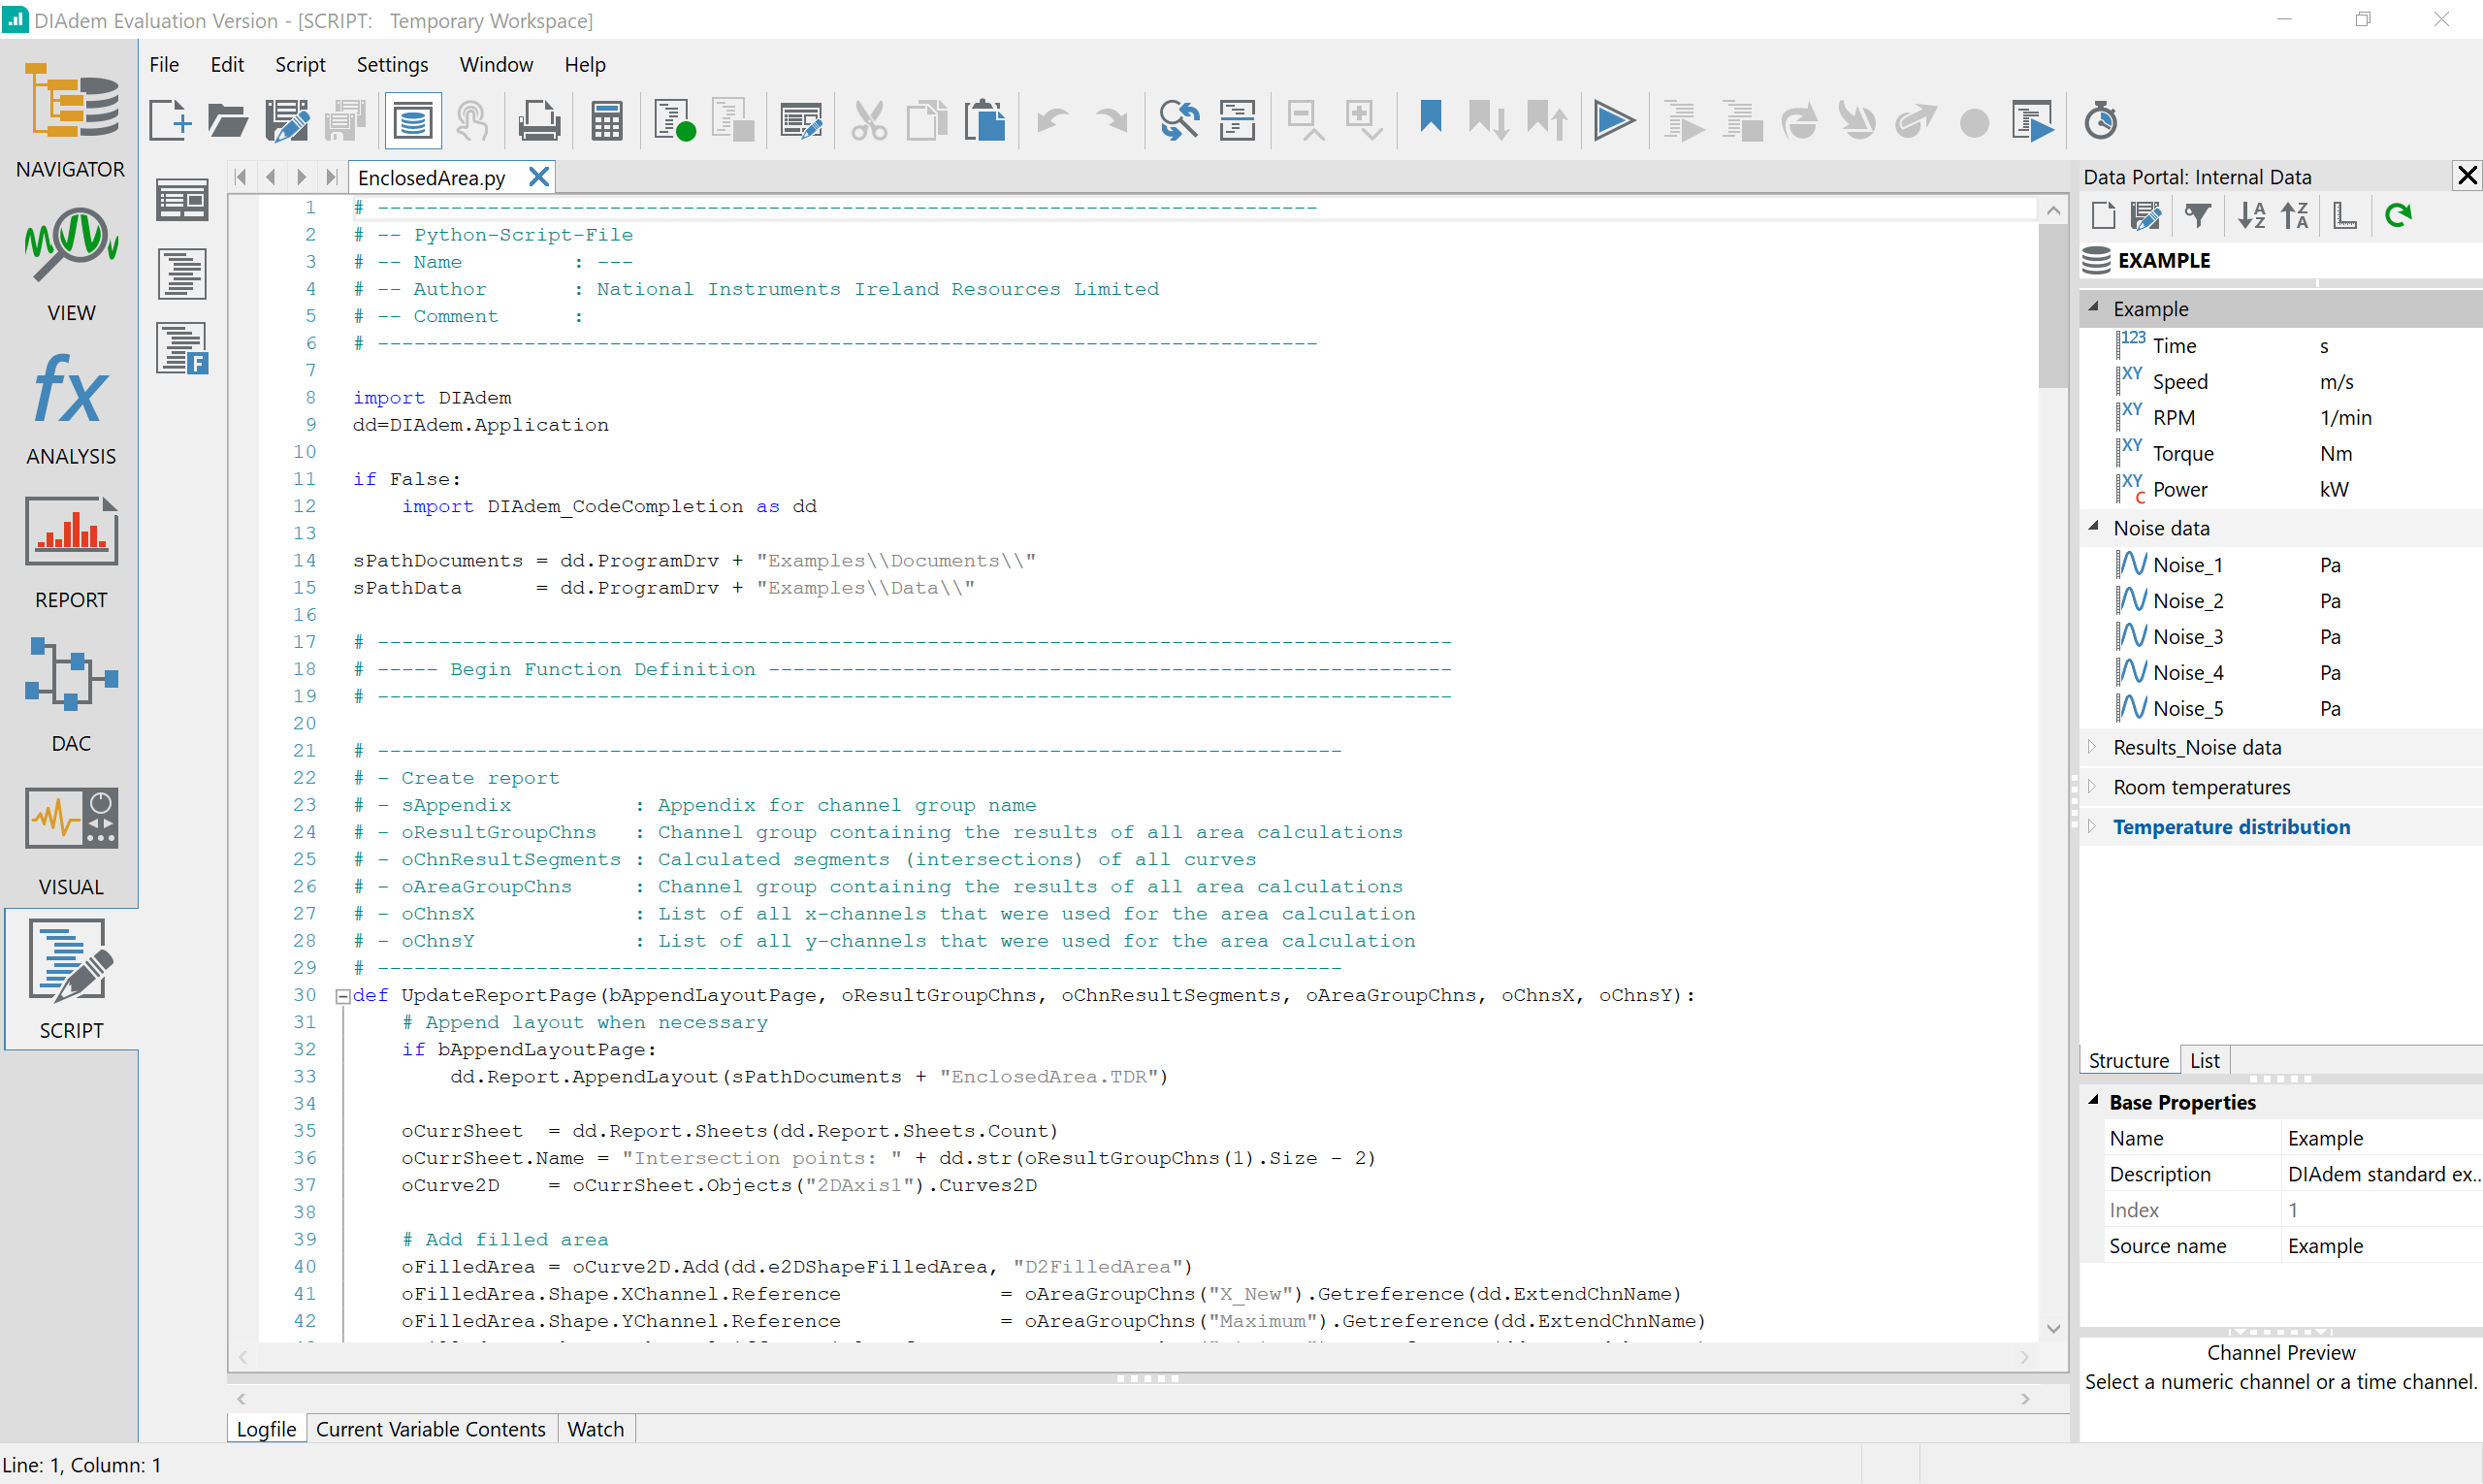
Fourier Transform analysis and Time channel editing. The raw data is converted automatically into physical values. This is done using conversion rules from the database. This is the best thing I liked while using the software. The Graphical interface is flexible and easy to use without any programming skills & provides a universal platform for numerous applications in diverse fields
What do you dislike?
Little slow while handling more number of channels.
I already tried using queues to transfer data, but control over memory-allocation / deallocation can't easily be done... perhaps a switch in the connector pane of subVIs saying "transfer data by pointers" could be helpful.
- Data structures: I am using some C++-DLLs for data analysis. As there are sometimes some structs in the function-arguments-list, I had to write a wrapper-DLL. Perhaps there's a possibility to get this compatible... it would be nice if an array of a cluster could be converted to an array of a struct.
- Speed: In some applications, I already realized that the speed of LabView can be improved by rewriting LabView-Sub-Vis into C++code. I think this is due to the LV-runtime-engine which has to "convert" the binary code of labview into native code??? Would be great if it would be possible to generate native code directly.
- Expandability: It's hard to implement new functions into a already written LV-Program. By using design patterns like producer-consumer, the expandability is improved in comparison to a "normal" LV-program, but in comparison to a text-based language, LV still stands back.
Recommendations to others considering the product:
Its a very nice software, handy and less memory space needed while operating this software. So, it will be helpful for new users to learn and implement faster. Very easy to learn and work. Faster to export the data from the analyzed software. So, I recommend for new users. DIAdem can be used in all phases of the development and production of vehicles, where measurement data must be analyzed, compared and presented together with the results in meaningful reports.
What problems are you solving with the product? What benefits have you realized?
Order tracking and multi axis chart preparation is easier


